All published articles of this journal are available on ScienceDirect.

Dimethylsulfoniopropionate (DMSP) Degradation by Marine Bacteria along the Cochin Estuarine System
Abstract
Introduction
Dimethylsulfoniopropionate (DMSP) is a key marine organosulfur compound produced by phytoplankton and macroalgae that functions as an osmolyte, antioxidant, and precursor of dimethylsulfide (DMS)-a climate-relevant gas influencing the global radiation balance. Marine bacteria degrade DMSP through demethylation and cleavage pathways, driving the marine sulfur cycle. This study aimed to quantify DMS(P) concentrations and to isolate, identify, and characterize DMSP-degrading bacteria from the Cochin Estuary (CE), Kerala, India.
Methods
Surface water and sediment samples were collected from fifteen CE stations across three seasonal regimes (pre-monsoon, monsoon, and post-monsoon) between 2015 and 2018. DMS(P) levels were determined by alkali hydrolysis followed by gas chromatography with headspace sampling. Heterotrophic bacterial abundance was estimated by spread plating on Zobell’s Marine Agar. DMSP-degrading bacteria were isolated on DMSP-enriched minimal medium, and selected isolates were identified by 16S rRNA gene sequencing. PCR amplification was performed to detect DMSP lyase (Ddd) genes, and phylogenetic analyses were conducted using MEGA6.
Results
DMSP concentrations ranged from BDL to 0.15 ng/µL in water and 0.01 to 2.35 ng/µL in sediments, with higher values recorded during the pre-monsoon season. A total of 112 water and 211 sediment bacterial isolates were obtained, with Gram-negative strains dominating (70% in water and 64% in sediment). Sediments harbored higher bacterial counts than water. Four isolates capable of growing on DMSP-enriched medium were identified: Acinetobacter calcoaceticus, Acinetobacter beijerinckii, Bacillus cereus, and Lysinibacillus fusiformis. Amplification of the dddP gene was observed in A. calcoaceticus. Seasonal variations in salinity, temperature, and nutrient levels influenced DMS(P) distribution, with higher concentrations recorded in sediments.
Discussion
The findings confirm CE sediments as microbial “hotspots,” dominated by γ-Proteobacteria and Firmicutes-groups known for their significant roles in sulfur cycling. Hydrographic seasonality, particularly salinity fluctuations, shaped bacterial diversity and DMSP transformation patterns. The detection of DddP genes suggests active enzymatic cleavage pathways contributing to atmospheric DMS release.
Conclusion
This first baseline study on DMSP degradation in the CE highlights the ecological significance of estuarine sediments in sulfur cycling. The results enhance the understanding of microbial mediation of DMSP catabolism in tropical estuaries and its implications for climate regulation. Further research is warranted to elucidate additional catabolic pathways and environmental controls.
1. INTRODUCTION
Dimethylsulfoniopropionate (DMSP) is an organic sulfur compound produced in significant quantities by marine phytoplankton, including coccolithophores, dinoflagellates, and diatoms, on a global scale (approximately 2.0 Pg S annually) [1-6]. It functions as an osmoprotectant [7, 8], antioxidant [9, 10], predator deterrent [11, 12], cryoprotectant [6], chemical signaling molecule [13, 14], and chemoattractant [15, 16], and provides protection against hydrostatic pressure [17] while serving as a major reservoir of reduced sulfur and carbon [18, 19]. Upon release into seawater through exudation, grazing, viral lysis, or senescence, DMSP enters the dissolved pool (DMSPd) and becomes available to microbial communities [20-24].
Dimethylsulfide (DMS), a volatile gas derived from DMSP cleavage, plays a vital role in regulating the Earth’s radiation balance by acting as a precursor to cloud condensation nuclei [25-27]. Oceanic DMS emissions contribute approximately 17-34 Tg S yr−1, representing 80-90% of all marine biogenic sulfur emissions and nearly 50% of the total global biogenic sulfur flux [28-31]. Therefore, understanding DMSP degradation in coastal and estuarine systems is crucial for evaluating their contribution to global sulfur cycling and climate regulation.
Marine heterotrophic bacteria are the principal mediators of DMSP breakdown, driving the biogenic transfer of sulfur from the marine biosphere to the atmosphere [31-33]. The main bacterial degraders include members of the Roseobacter clade and the SAR11 group [34]. DMSP catabolism occurs via three primary pathways: the demethylation pathway (converting ~75% of DMSPd into methylmercaptopropionate) [35-37], the cleavage pathway (producing DMS and acrylate) [35, 38], and the less characterized oxidation pathway leading to DMSO production [39]. These pathways are catalyzed by various enzymes such as DmdA-D (demethylation) [36] and DMSP lyases (DddP, DddL, DddQ, DddW, DddK, DddY, DddD, DddX, and DddU) [40-44]. Among these, DddP is the most widespread lyase in marine bacteria [45-47]. However, most studies have focused on open ocean environments, while data from estuarine systems remain scarce. Given their high productivity, variable salinity, and strong anthropogenic influence, estuaries represent potential microbial hotspots for DMSP cycling that are poorly characterized [48-52].
The Cochin Estuarine System (CE), located along the southwest coast of India (09°30′-10°10′N, 76°15′-76° 25′E), is one of the most dynamic and productive tropical estuaries, influenced by monsoonal freshwater inflow and tidal mixing. Its hydrographic variability, nutrient loading, and phytoplankton abundance create favorable conditions for intense microbial activity. However, while numerous hydrographic and planktonic studies exist for the CE [53, 54], no prior research has examined the microbial degradation of DMSP or identified DMSP-catabolizing bacteria and genes in this region. This represents a major gap in understanding the estuary’s contribution to sulfur flux and climate-relevant DMS production.
We hypothesize that the sediments of the Cochin Estuary act as microbial hotspots for DMSP degradation due to their enriched organic matter content and higher bacterial diversity, resulting in an increased abundance of DMSP-catabolic genes compared to the overlying waters. Therefore, the present study was performed to (i) quantify spatial and seasonal variations of DMS(P) in the Cochin Estuary, (ii) isolate and characterize culturable DMSP-degrading bacteria, and (iii) detect key DMSP lyase genes (DddP and related) using molecular approaches. By integrating chemical, microbiological, and molecular data, this work provides the first baseline framework for understanding the microbial mediation of DMSP catabolism and sulphur flux in a tropical Indian estuary, thereby filling a major knowledge gap in regional and global sulphur-cycle research.
2. MATERIALS AND METHODS
2.1. Study Area and Sampling Stations
The Cochin Estuary (CE) is extensively used for fishing, waterway transport, and as a hub for various industrial units, in addition to being a renowned tourist destination. It extends approximately 80 km, covering an area of about 300 km2 (Fig. 1). This aquatic system is often used as a disposal site for domestic waste and untreated industrial effluents. The CE receives an annual rainfall of about 325 cm, primarily influenced by the southwest monsoon (major share ~60%) and the northeast monsoon along the west coast of India [55]. The major rivers discharging freshwater (approximately 20,000 × 106 m3 annually) into this estuarine system include the Periyar in the north; the Pampa, Achankovil, Manimala, and Meenachil in the south; and the Muvattupuzha, which lies midway between the two [56]. The CE connects to the Arabian Sea at two locations - the Cochin inlet (450 m wide, average depth 8-10 m), a permanent bar mouth near the Cochin harbour (central region), and the Munambam inlet (150 m wide, northern region), where the depth is relatively shallow [57].
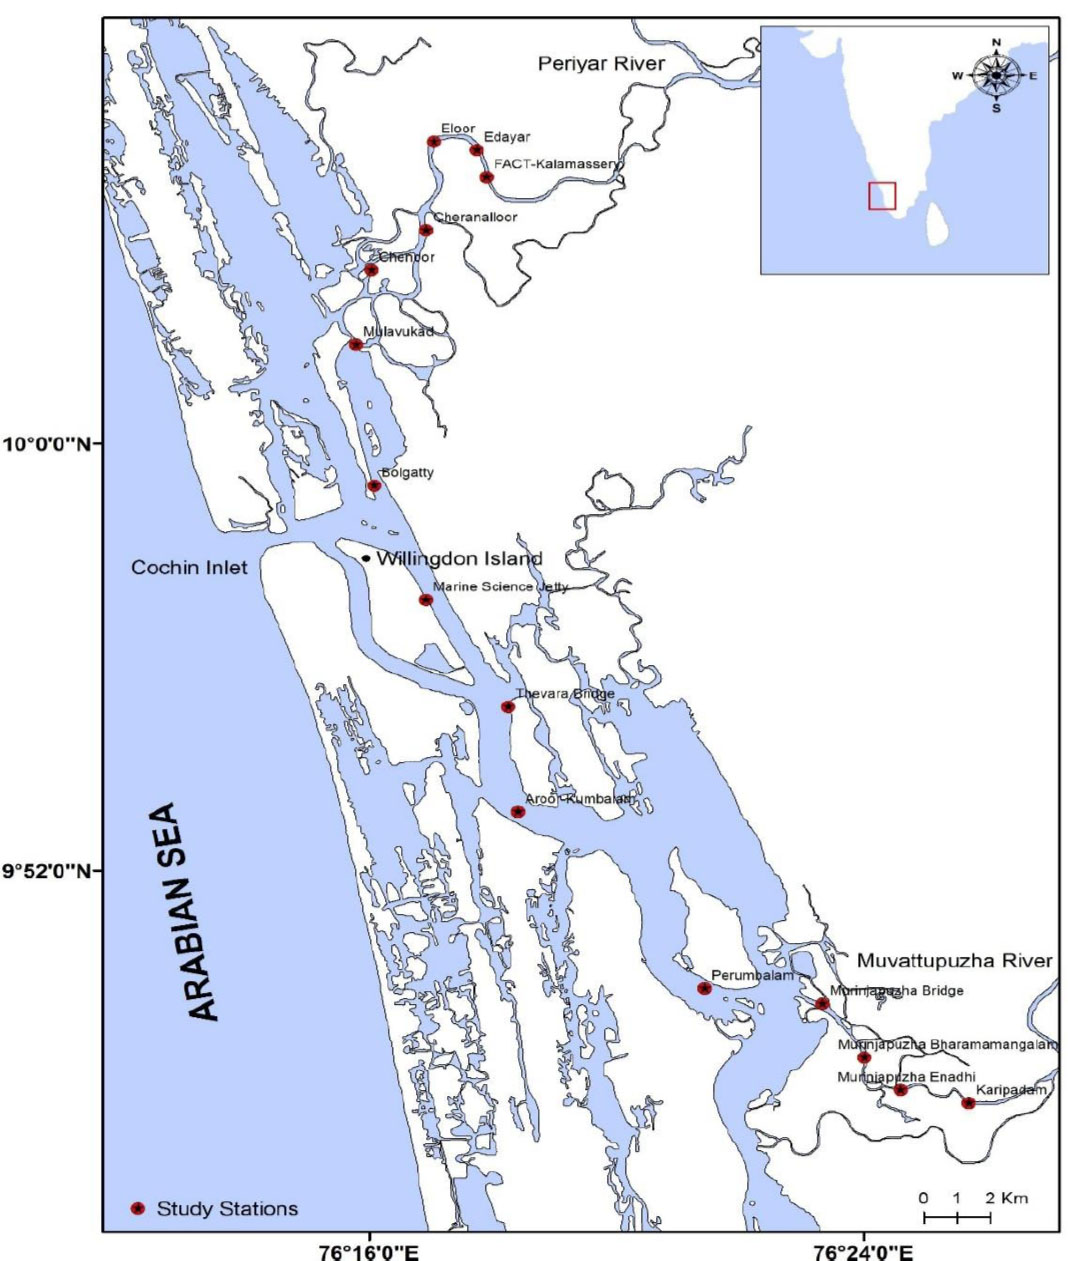
Map showing the Cochin Estuary (CE) located along the southwest coast of India, illustrating the fifteen sampling stations (S1-S15) distributed across the upper, middle, and lower estuarine zones. The upper estuary (S1-S5) represents the freshwater-dominated region influenced by riverine discharge; the middle zone (S6-S11) experiences tidal mixing and saline intrusion from the Arabian Sea; and the lower zone (S12-S15) is subject to strong anthropogenic influence from surrounding industrial activities. Major river systems (Periyar, Muvattupuzha, Pampa, Achankovil, Manimala, and Meenachil) and the two inlets (Cochin and Munambam) connecting the estuary to the Arabian Sea are also indicated. Sampling stations were georeferenced using GPS and mapped using ArcGIS 10.8 to depict hydrographic gradients across seasons.
| S.No. | Estuary | Station Code | Depth (m) | Station Name | Latitude | Longitude |
|---|---|---|---|---|---|---|
| 1. | Upper | S1 | 1.5-5 | Karippadam | 09° 47.646’N | 076° 25.708’E |
| 2. | S2 | 3.5-5 | Murinjapuzha Enadhi | 09° 47.887’N | 076° 24.607’E | |
| 3. | S3 | 4.5-8 | Murinjapuzha Bhramamangalam | 09° 48.495’N | 076° 24.019’E | |
| 4. | S4 | 4-7.5 | Murinjapuzha Bridge | 09° 49.508’N | 076° 23.359’E | |
| 5. | S5 | 1.5-4 | Perumpalam | 09° 49.793’N | 076° 21.430’E | |
| 6. | Middle | S6 | 6-8.5 | Aroor- Kumbalam | 09° 53.105’N | 076° 18.409’E |
| 7. | S7 | 1.5-4 | Thevara | 09° 55.070’N | 076° 18.253’E | |
| 8. | S8 | 2-5 | Marine Sciences Jetty | 09° 57.077’N | 076° 16.919’E | |
| 9. | S9 | 1-3 | Bolgatty | 09° 59.213’N | 076° 16.084’E | |
| 10. | S10 | 1-2.5 | Mulavukadu | 10° 01.857’N | 076° 15.789’E | |
| 11. | S11 | 1-2 | Chenoor | 10° 03.255’N | 076° 16.043’E | |
| 12. | Lower | S12 | 1.1-2.5 | Cheranellur | 10° 03.999’N | 076° 16.924’E |
| 13. | S13 | 3-6.5 | Eloor | 10° 05.656’N | 076° 17.049’E | |
| 14. | S14 | 1.5-3 | Edayar | 10° 05.502’N | 076°17.744 ’E | |
| 15. | S15 | 1.5-4 | Kalamassery- FACT | 10° 04.993’N | 076° 17.906’E |
Considering these environmental features, six sampling campaigns were conducted between 2015 and 2018 across fifteen identified sampling stations along the tropical water bay. These were categorized into three seasonal regimes: pre-monsoon (PRM’15 and PRM’16), monsoon (MON’15 and MON’16), and post-monsoon (POM’15 and POM’18). Estuarine surface water and sediment samples were collected from these fifteen predefined stations (S1-S15) of the CE (09°47.646′- 10°04.993′ N; 76°25.708′-76°17.906′ E) for DMS(P) quantification. Based on topography, the sampling sites were divided into three zones, namely upper, middle, and lower (Table 1). The upper estuary (S1-S5) exhibits predominantly riverine characteristics. The middle estuary (S6-S11) connects to the Arabian Sea and experiences irregular saline water intrusion, influenced by the Thanneermukkam bund, which alters water quality (WQ). The lower estuary (S12-S15) is the most complex, as it is affected by numerous small- and large-scale industrial units along the riverbanks, which discharge untreated effluents directly into the water.
Water samples were aseptically collected using a clean bucket, while surface sediment samples (top 0-5 cm) were collected using a Van Veen Grab (0.05 m2 area) at each station to obtain representative composites. The sediments were thoroughly mixed and homogenized in aluminium trays to ensure uniformity. All samples were transferred into appropriately labelled glass jars, kept in ice boxes on board, and transported to the laboratory, where they were stored at -20 °C until further analysis. At each station, water samples were analysed for physicochemical parameters, including salinity, pH, temperature, depth, transparency, dissolved oxygen (DO), and nutrients.
2.2. DMSP Analysis
DMSP is a naturally occurring sulphonium compound that hydrolyses into DMS and acrylic acid upon aqueous alkali treatment at room temperature [58]. Determination of DMSP concentration involved hydrolyzing DMSP into DMS and acrylic acid using an aqueous 10 M NaOH solution. One gram of sediment sample was mixed with 5 mL of sterile distilled water, and 10 mL of water sample was placed in separate glass vials. Then, 0.5 mL of 10 M NaOH was added to initiate hydrolysis. The vials were sealed with aluminium crimp caps fitted with Teflon-coated butyl rubber septa and left to react at room temperature for at least 12 hours to ensure complete cleavage of DMSP into DMS.
DMSP concentration was determined indirectly as DMS using Gas Chromatography-Headspace (GC-HS) analysis [59]. Each gas-tight vial contained both liquid and gas phases. After DMSP degradation, DMS accumulated in the aqueous phase and diffused into the gas phase. The DMS concentration in the headspace was measured sequentially to determine production rates.
DMS analysis was performed using an Agilent Technologies 7890A GC system equipped with a Flame Photometric Detector (FPD) and a Headspace Sampler (Agilent Technologies 7697A). The detector, injector, and oven temperatures were set at 150 °C, 95 °C, and 90 °C, respectively. The flow rates for air, hydrogen, and nitrogen (carrier gas) were 60-, 50-, and 59.5-mL min−1, respectively. The retention time for DMS was 2.5 minutes. Calibration curves were established using serial dilutions of DMSP stock solutions as working standards.
2.3. Estimation of the Abundance of Heterotrophic Bacteria
Physicochemical factors greatly influence microbial community structure in aquatic ecosystems. To estimate total bacterial counts and community composition, water and sediment samples were aseptically collected and transferred into sterile, labelled polypropylene bags. Samples were stored at 4-5 °C until analysis.
An aliquot (1 mL) of the water sample was serially diluted (10−5 to 10−6) with sterile seawater and spread-plated in triplicate on Zobell’s Marine Agar 2216. Plates were incubated at room temperature (24-48 h). After incubation, colony-forming units (CFU) were counted and expressed as CFU mL−1. Similarly, 1 g of the sediment sample was serially diluted, and CFU g−1 was determined. Colonies appearing on agar plates were streaked and re-streaked to obtain pure cultures, which were maintained on respective agar slants at 4 °C [60].
2.4. Bacterial Isolation Using DMSP-Enriched Medium
DMS production in the marine environment depends on both the phenotypic and phylogenetic diversity of bacteria. Culturable DMSP-degrading bacteria were isolated through serial dilution and spread plating (100 µL) directly onto f/2 medium, a minimal seawater-based medium, supplemented with 1 mM DMSP [61]. Isolates were obtained after 5 days of incubation in f/2-DMSP medium. Colonies exhibiting distinct morphologies were purified by streaking on f/2-DMSP agar plates for at least three to four successive passages to obtain pure cultures.
2.5. Isolation of Chromosomal DNA, PCR Amplification, and Sequencing
To overcome limitations in traditional enrichment and culture-based techniques, molecular and genetic approaches were employed to characterise the microbial community. DMSP-degrading isolates were cultured in Zobell’s Marine Broth overnight. Cells were harvested by centrifugation (12,000 × g, 1 min, 4 °C), and chromosomal DNA was isolated using the Genomic DNA Isolation Kit (Origin Diagnostics and Research) according to the manufacturer’s spin column protocol. Isolates were stored at -20 °C for further analysis.
PCR amplification was performed using 50 µL reaction volumes in a thermal cycler (Bio-Rad, T-100). The reaction mixture contained 5 µL template DNA, 2 µL of each primer (forward and reverse), 25 µL PCR master mix with DNA polymerase (Origin), and 16 µL deionized water.
All PCR reactions included appropriate controls to ensure reliability and eliminate contamination. A negative control (without template DNA) was included in each run to monitor reagent purity and detect background amplification. To prevent cross-contamination, pre- and post-PCR steps were conducted in sterile areas using filter tips. PCR setups were performed in a laminar flow hood wiped with 70% ethanol and UV-sterilized prior to use. Amplified products were resolved on 1.5% agarose gels; the absence of non-specific amplification in negative controls confirmed contamination-free reactions.
2.6. Amplification of 16S rRNA Gene
DNA isolated from DMSP-degrading isolates was used as a template to amplify the 16S rRNA gene using PCR Master Mix (Origin Diagnostics and Research). The primer pair 27F and 1514R (Table 2) was used for amplification. The thermal cycling conditions comprised an initial denaturation at 95 °C for 3 min, followed by 34 cycles of denaturation (95 °C for 30 s), annealing (55 °C for 30 s), and extension (72 °C for 30 s), with a final elongation at 72 °C for 7 min.
| Primer | Sequence |
|---|---|
| 16S rRNA Forward (27F) | 5’ - AGAGTTTGATCCTGGCTCAG - 3’ |
| 16S rRNA Reverse (1514R) | 5’ - AAGGAGGTGATCCAGCC - 3’ |
| DddP Forward _874F | 5’ - AAYGAAATWGTTGCCTTTGA - 3’ |
| DddP Reverse _971R | 5’ - GCATDGCRTAAATCATATC - 3’ |
| DddP Forward | 5’ - GAAGGTAAGATGATTCTG - 3’ |
| DddP Reverse | 5’ - TAATGTTGCCCATAATTC - 3’ |
| DddD Forward | 5’ - ACCAACGTCATTGCAGGACC - 3’ |
| DddD Reverse | 5’ - TGTGCGTGTTCTTCCGGTG - 3’ |
| DddR Forward | 5’ - GGCGCGCAGCCAGTTCAG - 3’ |
| DddR Reverse | 5’ - GGCTATGAGGAGGGCTGG - 3’ |
| DddL Forward | 5’ - CTGGGAATACGGCTACGAGA - 3’ |
| DddL Reverse | 5’ - GTTCAAGATCAGCGATCCGG - 3’ |
2.7. Amplification of ddd Genes
The presence of ddd genes was determined by PCR in bacterial strains capable of growing on minimal medium supplemented with DMSP as the sole carbon source. Amplification was performed using specific primer sets (Table 2) targeting DMSP lyase genes (dddP, dddD, dddR, dddL). The thermal profile consisted of an initial denaturation at 94 °C for 3 min, followed by 34 cycles of denaturation at 94 °C for 1 min, annealing at 60 °C for 1 min, and extension at 72 °C for 1.5 min, with a final elongation at 72 °C for 7 min.
PCR products of the 16S rRNA and ddd genes were analysed on 1.5% agarose gels using a 1 kb DNA ladder to confirm molecular weights. Amplified products exhibiting distinct bands were sent to SciGenom Labs (SciGenom Labs Pvt. Ltd., Kerala, India) for sequencing.
2.8. Phylogenetic Analyses of the 16S rDNA Sequences
Phylogenetic analysis was performed to identify sequence similarity among organisms and gain insight into the physiology and ecology of the isolated species. Each 16S rDNA sequence was analysed using the NCBI GenBank database via BLAST to determine the closest phylogenetic neighbor [62-64]. Sequences were compiled using BioEdit 7.0.9 [65], and multiple sequence alignment was performed using ClustalX [66]. Alignment included known bacterial sequences (Table 3) closely related to the isolates, based on BLAST results, with unrelated phyla used as outgroups.
Phylogenetic trees were constructed using the maximum likelihood method in MEGA6 software [67]. Evolutionary distances were calculated using the Kimura two-parameter model. Neighbor-joining bootstrap tests of phylogeny were performed with 1,000 replicates [68]. The nucleotide sequences obtained in this study were deposited in the GenBank database (http://www.ncbi.nlm. nih.gov).
| Class | Name of the Bacteria | Accession No. |
|---|---|---|
| γ-Proteobacteria | Acinetobacter baumanii | U10874 |
| SAR11 | X52172 | |
| DMSP-degrading bacterium | L15345 | |
| Moraxella lacunata | AF005171 | |
| DBT_COD04 Acinetobacter calcoaceticus | MG779635 | |
| DBT_COD05 Acinetobacter beijerinckii | MH636873 | |
| Firmicutes | DBT_COD06 Bacillus cereus | MK874973 |
| DBT_COD07 Lysinibacillus fusiformis | MK874993 | |
| Bacillus subtilis | AB01848 |
2.9. Statistical and Correlation Analysis
In the present study, all measurements were performed in triplicate, and results are presented as mean ± standard deviation (SD). The derived dataset on PRM, MON, and POM seasons was checked for statistical interpretation, and was analysed by SPSS to calculate the average mean, standard deviation, and Pearson’s correlation (r) value. The ANOVA test (level of significance α = 0.05) was employed to understand the spatio-temporal coverage in the observed physico-chemical parameters of the sampling stations and to determine the relationship between various physico-chemical parameters and total bacterial count against DMS and DMSP. We emphasized correlations greater than 0.5, as they are generally considered moderate to strong, indicating a fairly strong relationship between the two variables.
3. RESULTS
3.1. Effect of Environmental Factors
The distribution of DMSP and DMS in estuarine waters is influenced by various physicochemical factors such as salinity, pH, temperature, nutrient availability, and biological factors, including phytoplankton and bacterial biomass and their composition. Intense phytoplankton blooms and high biological activity during warmer seasons led to increased DMSP production and its biodegradation product, DMS.
During the pre-monsoon (PRM) period, the maximum salinity (35 psu) was recorded at S8 (Marine Sciences Boat Jetty), whereas minimal salinity was observed during the monsoon and post-monsoon seasons. The average salinity was the highest in the pre-monsoon season (8.9 ± 7.6 psu), followed by decreases during the post-monsoon and monsoon seasons (2.9 ± 5.5 psu and 2.2 ± 4.4 psu, respectively). Surface water temperatures at the fifteen sampling stations ranged from 26-34 °C, 24-27 °C, and 26-30 °C in the pre-monsoon, monsoon, and post-monsoon seasons, respectively. Salinity and temperature were the most significant factors influencing DMSP production [53].
The average pH of the estuary was the highest in the post-monsoon season (7.65 ± 0.39), followed by the monsoon and pre-monsoon seasons (7.48 ± 0.81 and 6.98 ± 0.49, respectively). Dissolved oxygen (DO) levels were the highest during the post-monsoon season (3.27 ± 1.68 mg L−1), followed by the monsoon and pre-monsoon seasons (3.21 ± 0.66 mg L−1 and 1.8 ± 1.3 mg L−1, respectively).
The average nitrite concentration was the highest during the monsoon season (0.34 ± 0.13 µmol L−1), followed by the pre-monsoon and post-monsoon seasons (0.18 ± 0.20 µmol L−1 and 0.13 ± 0.07 µmol L−1, respectively). Average nitrate concentrations were the highest in the pre-monsoon season (3.8 ± 1.4 µmol L−1), followed by the monsoon and post-monsoon seasons (1.3 ± 0.8 µmol L−1 and 0.18 ± 0.1 µmol L−1, respectively). Nitrogen availability is a well-known factor influencing the intracellular DMSP levels in marine phytoplankton [69].
Silicate concentrations in the CE were the highest during the pre-monsoon season (21.64 ± 6.25 µmol L−1), followed by the post-monsoon and monsoon seasons (18.63 ± 6.33 µmol L−1 and 11.91 ± 6.8 µmol L−1, respectively). Silicate indirectly affects DMSP production by supporting the growth of larger nanoplankton [53, 70].
Significant positive correlations were observed between DMSP concentrations and salinity (r = 0.68, p < 0.05), indicating enhanced DMSP accumulation under saline pre-monsoon conditions. Conversely, temperature showed a moderate positive correlation (r = 0.52, p < 0.05), suggesting that warmer conditions favor phytoplankton DMSP production. Nutrient parameters such as nitrate and silicate exhibited weaker negative correlations (r = -0.34 and -0.28, respectively), implying dilution or uptake effects during high biological activity. These relationships support the view that hydrographic variability-particularly salinity and temperature-plays a dominant role in modulating DMSP dynamics in tropical estuarine systems.
3.2. DMS Quantification
The water and sediment samples collected were subjected to GC-Headspace analysis for the estimation of DMS(P). The water samples showed concentrations below the detection limit of DMS(P). Whereas some of the sediment samples from the stations - S4, S5, S6, S7, S8, S9, S11, and S12 showed varying concentrations of the DMSP during the sampling period. The stations S4 & S5 were located in the upper part of the estuary, which showed riverine characteristics. Whereas stations S6, 7, 8, 9, and 11 were located in the middle part of the estuary, which had a persistent connection to the Arabian Sea and displayed both riverine and saline characteristics on a seasonal basis. And the station S12 in the lower part of the estuary, which was regularly polluted by minor and major industries located on the estuary's banks. The highest DMSP concentration was found at station S7 (Thevara), recording a concentration of 2.35 ng/µl during the first sampling period. The average DMSP concentration at this station was about 0.99 ng/µl, and the lowest (Murinjapuzha Bridge) was about 0.21 ng/µl at S4 during the sampling period (Table 4).
| Stations | Period | DMS Water (ng/µl) | DMSP Water (ng/µl) | DMS Sediment (ng/µl) | DMSP Sediment (ng/µl) |
|---|---|---|---|---|---|
| S1 | PRM’15 | ND | ND | ND | ND |
| MON’15 | ND | ND | ND | ND | |
| POM’15 | ND | ND | ND | ND | |
| PRM’16 | 0.26 | ND | ND | ND | |
| MON’16 | ND | ND | 0.16 | ND | |
| POM’18 | ND | ND | ND | 0.16 | |
| S2 | PRM’15 | ND | ND | 0.027 | ND |
| MON’15 | ND | ND | ND | ND | |
| POM’15 | ND | ND | ND | ND | |
| PRM’16 | 0.261 | ND | ND | 0.26 | |
| MON’16 | 0.15 | ND | 0.15 | ND | |
| POM’18 | ND | 0.15 | ND | 0.15 | |
| S3 | PRM’15 | ND | ND | ND | ND |
| MON’15 | ND | ND | ND | ND | |
| POM’15 | ND | ND | ND | ND | |
| PRM’16 | ND | ND | ND | ND | |
| MON’16 | ND | ND | ND | ND | |
| POM’18 | ND | ND | ND | 0.16 | |
| S4 | PRM’15 | ND | ND | ND | ND |
| MON’15 | ND | ND | 0.15 | ND | |
| POM’15 | ND | ND | 0.25 | ND | |
| PRM’16 | ND | ND | 0.27 | 0.275 | |
| MON’16 | 0.15 | ND | 0.2 | ND | |
| POM’18 | ND | ND | ND | 0.24 | |
| S5 | PRM’15 | ND | ND | 0.84 | ND |
| MON’15 | ND | ND | 0.52 | ND | |
| POM’15 | ND | ND | 0.5 | ND | |
| PRM’16 | ND | ND | 0.31 | 0.3 | |
| MON’16 | 0.16 | ND | 0.22 | ND | |
| POM’18 | ND | 0.15 | 0.25 | 0.25 | |
| S6 | PRM’15 | ND | ND | 1.63 | ND |
| MON’15 | ND | ND | 0.23 | ND | |
| POM’15 | ND | ND | 0.66 | ND | |
| PRM’16 | ND | ND | 0.32 | 0.3 | |
| MON’16 | 0.15 | ND | 0.3 | ND | |
| POM’18 | ND | ND | 0.25 | 0.2 | |
| S7 | PRM’15 | ND | ND | 2.35 | ND |
| MON’15 | ND | ND | 0.5 | ND | |
| POM’15 | ND | ND | 1.05 | ND | |
| PRM’16 | ND | ND | 0.8 | 0.29 | |
| MON’16 | 0.15 | ND | 0.5 | ND | |
| POM’18 | 0.15 | ND | 0.59 | 0.19 | |
| S8 | PRM’15 | ND | ND | 1.85 | ND |
| MON’15 | ND | ND | 0.25 | ND | |
| POM’15 | ND | ND | 0.86 | ND | |
| PRM’16 | ND | 0.261 | 0.27 | 0.27 | |
| MON’16 | 0.15 | ND | 0.25 | ND | |
| POM’18 | ND | ND | 0.22 | 0.21 | |
| S9 | PRM’15 | ND | ND | 1.51 | ND |
| MON’15 | ND | ND | ND | ND | |
| POM’15 | ND | ND | 0.18 | ND | |
| PRM’16 | ND | ND | 0.28 | 0.28 | |
| MON’16 | ND | ND | 0.28 | ND | |
| POM’18 | ND | 0.15 | 0.18 | 0.18 | |
| S10 | PRM’15 | ND | ND | 0.16 | ND |
| MON’15 | ND | ND | ND | ND | |
| POM’15 | ND | ND | ND | ND | |
| PRM’16 | ND | ND | ND | ND | |
| MON’16 | 0.16 | ND | 0.16 | ND | |
| POM’18 | 0.16 | 0.16 | ND | 0.17 | |
| S11 | PRM’15 | ND | ND | 1.62 | ND |
| MON’15 | ND | ND | 0.16 | ND | |
| POM’15 | ND | ND | 0.16 | ND | |
| PRM’16 | ND | ND | 0.23 | 0.26 | |
| MON’16 | ND | ND | 0.26 | ND | |
| POM’18 | ND | 0.16 | ND | 0.17 | |
| S12 | PRM’15 | ND | ND | 0.71 | ND |
| MON’15 | ND | ND | 0.18 | ND | |
| POM’15 | ND | ND | 0.15 | ND | |
| PRM’16 | ND | ND | ND | 0.27 | |
| MON’16 | ND | ND | 0.16 | ND | |
| POM’18 | ND | 0.16 | ND | 0.16 | |
| S13 | PRM’15 | ND | ND | 0.084 | ND |
| MON’15 | ND | ND | ND | ND | |
| POM’15 | ND | ND | 0.14 | ND | |
| PRM’16 | ND | ND | ND | ND | |
| MON’16 | 0.16 | ND | 0.15 | ND | |
| POM’18 | ND | 0.15 | ND | 0.16 | |
| S14 | PRM’15 | ND | ND | 0.33 | ND |
| MON’15 | ND | ND | ND | ND | |
| POM’15 | ND | ND | ND | ND | |
| PRM’16 | ND | ND | ND | ND | |
| MON’16 | ND | ND | 0.16 | ND | |
| POM’18 | ND | 0.15 | ND | 0.16 | |
| S15 | PRM’15 | ND | ND | 0.075 | ND |
| MON’15 | ND | ND | ND | ND | |
| POM’15 | ND | ND | 0.15 | ND | |
| PRM’16 | ND | ND | ND | ND | |
| MON’16 | 0.16 | ND | ND | ND | |
| POM’18 | ND | 0.16 | ND | 0.16 |
3.3. Heterotrophic Bacterial Community in the Cochin Estuary (CE)
Seasonal and environmental fluctuations influence the physicochemical parameters of estuarine systems, which in turn affect microbial community composition. In marine environments, up to 90% of bacteria are Gram-negative, as their cell wall structure is better adapted for survival in saline conditions. The proportion of Gram-negative and Gram-positive bacterial isolates showed consistent seasonal and spatial variation (Table 5).
A total of 112 bacterial strains were isolated from water samples collected from the Cochin Estuary. Gram-negative bacteria were dominant (70%) compared to Gram-positive bacteria (30%). The predominant genera isolated included Bacillus, Pseudomonas, Vibrio, and Staphylococcus.
In surficial sediments of the CE, the most predominant microbial groups were anaerobic Gram-negative and Gram-positive bacteria, particularly members of the Firmicutes. The second most dominant group was Gram-negative Proteobacteria. A total of 211 bacterial isolates were obtained from sediment samples. Of these, 136 were Gram-negative, and 75 were Gram-positive. Bacillus was the single largest genus, comprising 30% of the total count, followed by Vibrio (22%) and members of the Enterobacteriaceae (11%). The major genera identified were Bacillus, Vibrio, Pseudomonas, Acinetobacter, Micrococcus, Staphylococcus, Lysinibacillus, Novosphingobium, Rhodobacter, Arthrobacter, Enterobacteriaceae, Aeromonas, and Achromobacter.
| Sample Type |
PRM Mean ± SD (×106 CFU/mL or CFU/g) |
MON Mean ± SD (×106 CFU/mL or CFU/g) |
POM Mean ± SD (×106 CFU/mL or CFU/g) |
Gram-negative (%) | Gram-positive (%) |
|---|---|---|---|---|---|
| Water | 1.05 ± 0.53 | 1.19 ± 0.59 | 1.59 ± 0.77 | 70 | 30 |
| Sediment | 2.24 ± 1.35 | 1.22 ± 0.84 | 1.73 ± 1.11 | 64 | 36 |
3.4. Water
The estuarine water column is subject to wide fluctuations in physicochemical parameters (temperature, salinity, DO, pH, and nutrients), which vary with the prevailing seasons and result in rapid changes in bacterial abundance.
The total heterotrophic bacterial (THB) count in surface water samples ranged from 0.21 × 10⁶ to 3.02 × 10⁶ CFU mL−1. The highest THB was recorded at S8 (3.02 × 10⁶ CFU mL−1) during POM’18, while the lowest was observed at S2 (0.21 × 10⁶ CFU mL−1) during PRM’15 (Table 6).
3.5. Sediment
Estuarine sediments harbour a higher abundance and diversity of microorganisms with varying ecological functions. The surface sediments exhibited higher THB counts than surface waters, ranging from 0.27 × 10⁶ to 5.2 × 10⁶ CFU g−1 across the sampled stations. The highest THB was recorded at S8 (5.2 × 10⁶ CFU g−1) during PRM’16, while the lowest was observed at S2 (0.27 × 10⁶ CFU g−1) during MON’15 (Table 7).
As expected, sediment samples showed greater bacterial community richness and diversity than surface water samples. Sediments serve as repositories for bacterial communities and provide a more stable, protective environment for their survival. In contrast, surface water conditions are highly dynamic, particularly during the pre-monsoon seasons (2015 and 2016), where fluctuations in salinity and temperature create stressful conditions that inhibit microbial growth.
3.6. Enumeration of DMSP-Degrading Bacteria
DMSP, an organic sulphur compound, is rapidly metabolized by marine bacteria via cleavage to DMS. Bacterial DMSP-catabolic genes were most abundant in surface sediments with high DMSP concentrations, compared with surface waters.
Experiments were conducted to enrich DMSP-degrading bacteria from fifteen water and sediment samples. Only a small number of bacterial colonies grew on plates from the estuarine sediment sample (S7), indicating the utilization of DMSP in the culture medium, whereas no bacterial growth was observed on DMSP-containing plates from water samples.
| Stations | PRM'15 | MON'15 | POM'15 | PRM'16 | MON'16 | POM'18 |
|---|---|---|---|---|---|---|
| S1 | 0.35 | 0.5 | 0.77 | 0.3 | 0.32 | 0.8 |
| S2 | 0.21 | 0.32 | 0.41 | 0.4 | 0.42 | 0.53 |
| S3 | 0.45 | 0.71 | 0.82 | 0.51 | 0.47 | 0.8 |
| S4 | 0.44 | 0.59 | 0.7 | 0.59 | 0.44 | 0.72 |
| S5 | 0.55 | 0.89 | 1.05 | 0.62 | 0.57 | 1.15 |
| S6 | 1.49 | 1.9 | 2.2 | 1.59 | 1.48 | 2.01 |
| S7 | 2 | 2 | 2.39 | 1.67 | 1.5 | 2.41 |
| S8 | 1.47 | 2.5 | 3 | 2.2 | 2 | 3.02 |
| S9 | 1.61 | 2.2 | 2.54 | 1.7 | 1.61 | 2.55 |
| S10 | 1.19 | 1.95 | 2.14 | 1.25 | 1.18 | 2.14 |
| S11 | 1.36 | 1.8 | 1.95 | 1.4 | 1.35 | 1.97 |
| S12 | 1.11 | 1.5 | 1.72 | 1.15 | 1.1 | 1.7 |
| S13 | 1.07 | 1.51 | 1.69 | 1.11 | 1.01 | 1.05 |
| S14 | 0.91 | 1.3 | 1.43 | 1 | 0.89 | 1.45 |
| S15 | 0.95 | 0.8 | 1.03 | 0.99 | 0.91 | 1 |
| Stations | PRM'15 | MON'15 | POM'15 | PRM'16 | MON'16 | POM'18 |
|---|---|---|---|---|---|---|
| S1 | 0.82 | 0.35 | 0.77 | 0.85 | 0.38 | 0.85 |
| S2 | 0.55 | 0.27 | 0.48 | 0.9 | 0.4 | 0.54 |
| S3 | 0.96 | 0.45 | 0.71 | 0.99 | 0.49 | 0.85 |
| S4 | 0.8 | 0.56 | 0.71 | 0.82 | 0.56 | 0.82 |
| S5 | 1.01 | 0.55 | 0.95 | 1.01 | 0.57 | 1.03 |
| S6 | 2.37 | 1.49 | 2 | 2.39 | 1.52 | 2.5 |
| S7 | 3.97 | 2.47 | 3.39 | 3.98 | 3 | 3.65 |
| S8 | 5.32 | 3 | 3.95 | 5.2 | 2.9 | 4.75 |
| S9 | 3.91 | 1.61 | 2.04 | 3.93 | 1.63 | 2.25 |
| S10 | 3.1 | 2.09 | 2.64 | 3.15 | 2.11 | 2.8 |
| S11 | 2.44 | 1.36 | 1.85 | 2.47 | 1.37 | 1.99 |
| S12 | 2.09 | 1.11 | 1.52 | 2.19 | 1.13 | 1.6 |
| S13 | 2.16 | 1.07 | 1.29 | 2.15 | 1.09 | 1.4 |
| S14 | 1.77 | 0.51 | 1.03 | 1.7 | 0.54 | 1.1 |
| S15 | 2 | 1.03 | 1.15 | 2.1 | 1.05 | 1.2 |
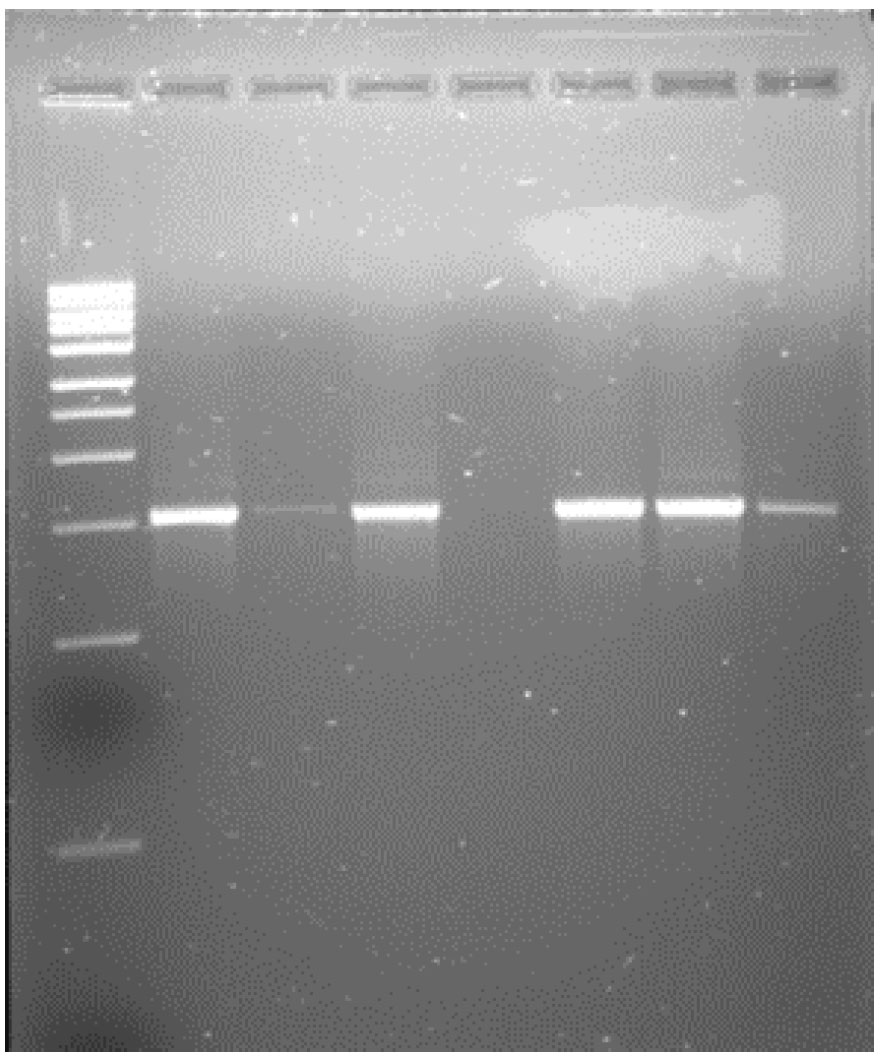
Agarose gel electrophoresis showing PCR amplification of the DMSP-degrading bacterial isolates obtained from the Cochin Estuary. Lanes 2, 4, 6 & 7 corresponds to isolates identified as Acinetobacter calcoaceticus, Acinetobacter beijerinckii, Bacillus cereus, and Lysinibacillus fusiformis, respectively. Lane 1 represents the 1 kb DNA ladder used as a molecular size marker. Lane 5 represents the Negative control (no-template PCR reactions) showing no amplification, confirming the absence of contamination.
Isolates were selected based on distinct colony morphology, representing both Gram-positive and Gram-negative strains. Four strains were selected for DNA isolation, PCR amplification (Fig. 2), and 16S rRNA gene sequencing. Several previous studies have reported Gram-negative DMS producers from marine environments [17, 41]. The Gram-negative isolates in this study were identified as members of the class γ-Proteobacteria, while the Gram-positive DMS producers belonged to the class Bacilli.
3.7. Phylogenetic Analysis
Phylogenetic trees were constructed to represent the evolutionary relationships among the isolates. The 16S rRNA gene sequences were successfully amplified using the primer pairs, reaction mixtures, and thermal regimes described in the Materials and Methods section. Sequence lengths ranged from 466 to 833 base pairs.
The gene sequences of the four isolates were subjected to BLAST analysis against the GenBank database to identify DMSP-degrading bacterial homologues. All sequences showed 97-99% similarity to known bacterial sequences. None was completely identical to any cultured bacterial species in the database. The closest match was Acinetobacter calcoaceticus (99% similarity), followed by Acinetobacter beijerinckii (98% similarity), while the remaining isolates showed 97% similarity to Bacillus cereus and Lysinibacillus fusiformis, respectively (Fig. 3).
The DMSP-degrading isolates were members of the classes γ-Proteobacteria (A. calcoaceticus and A. beijerinckii) and Firmicutes (B. cereus and L. fusiformis). These isolates were submitted to the GenBank database with accession numbers MG779635, MH636873, MK874973, and MK874993, respectively (details provided in the Supplementary File). Based on 16S rRNA sequencing and BLAST analysis, the isolate showing dddP gene amplification was identified as Acinetobacter calcoaceticus of the class γ-Proteobacteria.
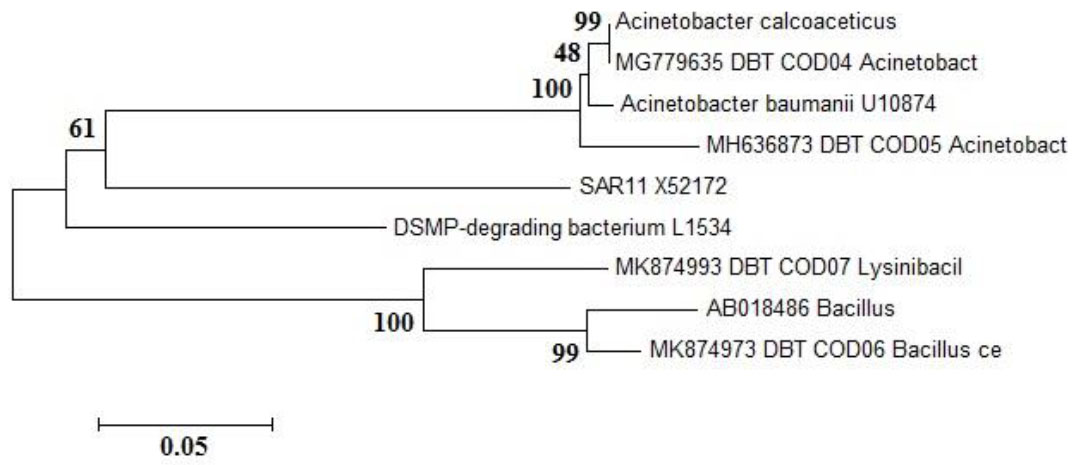
Maximum-likelihood phylogenetic tree illustrating the evolutionary relationships among the DMSP-degrading bacterial isolates from the Cochin Estuary and closely related reference strains retrieved from the NCBI GenBank database. The isolates identified in this study were Acinetobacter calcoaceticus, Acinetobacter beijerinckii, Bacillus cereus, and Lysinibacillus fusiformis. The tree was constructed using the MEGA6 software with the Kimura two-parameter model, and bootstrap analysis with 1,000 replicates was performed to evaluate the robustness of branching. Bootstrap values are shown at the nodes. The scale bar represents 0.05 nucleotide substitutions per site, indicating the evolutionary distance among taxa. Sequences from unrelated phyla were used as outgroups to root the tree.
4. DISCUSSION
Approximately 8 billion tonnes of DMSP are produced annually by phytoplankton, and its production has been widely studied in marine systems over the past years [46]. The cleavage of DMSP to DMS not only contributes to completing the global sulphur cycle but also significantly influences the Earth’s climate regulation. Earlier studies on DMSP and DMS distribution and concentration were largely confined to the marine euphotic zone, whereas sediments and deeper oceanic layers received little attention. Recent investigations have revealed that DMSP and DMS concentrations in marine sediments can reach levels nearly 1,000-fold higher than those in the overlying water column [71], identifying marine surface sediments as “hotspots” for DMSP production and catabolism.
The principal source of oceanic DMS is bacterial cleavage of DMSP, which plays an active role in transferring sulphur from the aquatic environment to the atmosphere. Previous research has shown that the main DMS producers belong to the α-, β-, γ-, and δ-subdivisions of the Proteobacteria, particularly the Roseobacter subgroup found in coastal and open-ocean waters [15]. In contrast, γ-Proteobacteria have been reported as the dominant contributors in estuarine sediments and salt marshes. In the present study, the DMSP-degrading bacterial isolates identified from the Cochin Estuary (CE) belonged predominantly to the γ-Proteobacteria class, which plays a major role in the DMSP-DMS cycle, along with members of the Firmicutes class known for their DMSP-degradation capabilities. Phylogenetic analyses revealed the identified isolates as Acinetobacter calcoaceticus and Acinetobacter beijerinckii (γ-Proteobacteria), and Bacillus cereus and Lysinibacillus fusiformis (Firmicutes).
Comparative studies from different aquatic systems reveal significant variability in DMSP and DMS concentrations, reflecting differences in hydrography, nutrient status, and microbial community composition. Estuarine and coastal sediments are increasingly recognized as microbial hotspots for DMSP catabolism, often exhibiting concentrations orders of magnitude higher than those in open ocean waters. The elevated DMSP pools and active Ddd gene presence indicate strong microbial mediation of the sulfur cycle, linking estuarine biogeochemistry with global climate regulation. A comparative overview is presented in Table 8.
The extensive utilization of estuarine water highlights the importance of maintaining good water quality (WQ) within the aquatic system. Variations in WQ have serious environmental implications that affect the overall health of the estuarine ecosystem. Among hydrological parameters, salinity is a key variable and an indicator of changing WQ. Salinity was the highest during the pre-monsoon season due to seawater intrusion into the estuary, whereas lower salinity was recorded during the monsoon season, which was a result of heavy rainfall limiting saltwater inflow. The post-monsoon period represents a transitional phase, with partially mixed estuarine conditions and intermediate salinity levels.
| Environment / Location | Habitat Type | Reported DMSP Range | Reported DMS Range | Dominant Microbial Groups | Reference |
|---|---|---|---|---|---|
| Open ocean |
Surface water | 0.1-2.5 µmol L−1 |
0.02-0.30 µmol L−1 | Roseobacter, SAR11 | [34, 45] |
| Coastal seawater |
Surface water | 1.0-6.5 µmol L−1 |
0.10-0.60 µmol L−1 | Ruegeria, Pelagibacter | [37] |
| Salt marsh sediments | Sediment | 5-25 µmol g−1 |
0.3-1.5 µmol g−1 | Alcaligenes, Desulfovibrio | [72, 73] |
| Estuarine sediments | Sediment | 3-18 µmol g−1 |
0.2-1.0 µmol g−1 | γ-Proteobacteria, Firmicutes | [52] |
Seasonal variations in hydrographic parameters were strongly influenced by monsoonal patterns. Heterotrophic bacterial populations in both water and sediment samples were dominated by Firmicutes, followed by Proteobacteria, which outweighed all other bacterial communities. Distinct differences in bacterial diversity between sediments and water samples were attributed to varying riverine inputs during different sampling seasons.
This study adds a new dimension to our understanding of the phylogenetic diversity of DMS-producing bacteria in the CE. It provides preliminary data on the distribution of DMSP-degrading bacteria in this least-explored tropical estuarine region of Kerala, India. The findings open new avenues for future multi-omics-based investigations aimed at elucidating the metabolic pathways and environmental controls underlying DMSP degradation in estuarine systems.
5. STUDY LIMITATIONS
Despite providing valuable insights into the DMSP-associated bacterial diversity and sulfur cycling in the Cochin estuary, some limitations can be addressed in this study. The sampling was limited to selected locations and seasons. This may not fully capture the strong spatial and monsoon-driven temporal variability of this dynamic estuarine system. The use of culture-dependent methods is likely to represent only a subset of the in situ microbial community, favouring the fast-growing taxa. Some environmental drivers known to influence the DMSP dynamics-such as dissolved organic matter composition, viral lysis, and grazing pressure-were not directly assessed. In addition, the identification was primarily based on 16S rRNA sequencing, which provides taxonomic resolution at the genus or species level only. At the same time, whole-genome sequencing would provide a more definitive metabolic picture.
Despite these limitations, this study provides foundational evidence on the diversity and ecological significance of DMSP-associated bacteria in the Cochin estuarine ecosystem. These findings should be interpreted within the methodological and environmental boundaries, while serving as a platform for future studies integrating metagenomic and metatranscriptomic approaches, along with more comprehensive spatial and seasonal sampling, to quantitatively determine the ecological contribution of DMSP-transforming bacteria to estuarine sulfur cycling.
CONCLUSION
This investigation presents the first baseline study of DMSP concentrations and DMSP-degrading bacterial communities along the Cochin Estuary, providing novel insights into the microbial mediation of sulphur cycling in a tropical estuarine environment. The quantification of DMS(P) using gas chromatography, together with the isolation and phylogenetic identification of key bacterial strains, highlights the ecological roles of γ-Proteobacteria and Firmicutes in DMSP catabolism.
The detection of Acinetobacter calcoaceticus and Bacillus cereus as DMSP-degrading bacteria underscores their ecological significance in estuarine sulphur cycling. A. calcoaceticus, carrying the dddP gene, actively participates in the cleavage of DMSP to DMS, linking microbial metabolism to atmospheric sulphur flux and climate regulation, while B. Cereus contributes to the remineralization of organosulphur compounds in sediments, sustaining sulphur turnover under variable oxygen conditions. Together, these taxa illustrate the functional coupling of aerobic and facultatively anaerobic bacterial processes that maintain the dynamic sulphur cycle within the Cochin Estuary.
Hydrographic variability-particularly fluctuations in salinity, temperature, and oxygen levels-exerts strong control over bacterial gene expression and DMSP metabolic pathways in tropical estuaries. These physicochemical changes influence both microbial community composition and the activity of key DMSP lyase genes, thereby modulating DMS release rates to the atmosphere. Such coupling between estuarine hydrography and microbial function underscores the sensitivity of sulphur cycling to climatic and anthropogenic perturbations.
The isolation of A. calcoaceticus and B. cereus as active DMSP degraders also presents potential for biotechnological and modelling applications. Their ability to mediate DMSP cleavage and sulphur turnover could be harnessed for the development of bioengineering strategies to regulate sulphur emissions or treat volatile organosulphur compounds in aquatic systems. Furthermore, incorporating physiological and genetic data from these isolates into biogeochemical and climate models can refine predictions of biological sulphur fluxes and DMS emission dynamics, improving the accuracy of climate projections related to aerosol formation and cloud condensation processes.
Overall, this study advances current understanding of the microbial ecology and genetic potential underlying DMSP transformation in Indian tropical estuaries, providing a foundation for future multi-omics-based research to elucidate the complete spectrum of DMSP-catabolizing pathways and their environmental regulation.
AUTHORS’ CONTRIBUTIONS
The authors confirm contribution to the paper as follows: S.C.H.: Study conception and design; D.D.: Sample DMSP analysis, data collection, interpretation of results, molecular genetic studies, and sequence alignment; D.D., S.C.H., D.E.M.: Drafting and correction of the manuscript. All authors reviewed the results and approved the final version of the manuscript.
LIST OF ABBREVIATIONS
| DMSP | = Dimethylsulfoniopropionate |
| CE | = Cochin Estuary |
| FPD | = Flame Photometric Detector |
| CFU | = Colony-Forming Units |
| SD | = Standard Deviation |
| THB | = Total Heterotrophic Bacterial |
AVAILABILITY OF DATA AND MATERIALS
The data suppor-ng the findings of the ar-cle is available in the Zenodo Repository at https://doi.org/10.5281/zenodo.19504720.
FUNDING
This study was funded by the Department of Biotechnology (DBT), Government of India, Funder ID - No ID, as it’s a Government agency, Awards/Grant number - BT/PR3233/AAQ/03/566/2011.
CONFLICT OF INTEREST
The author, Dr. Doniya Elze Mathew is the Editorial Advisory Board Member of The Open Biotechnology Journal.
ACKNOWLEDGEMENTS
This research work was supported by financial assistance from the Dept of Biotechnology (DBT), Govt of India. The authors wish to express sincere thanks to the Head of the Department of Chemical Oceanography, CUSAT, India, for providing the infrastructure, facilities, and support.