All published articles of this journal are available on ScienceDirect.

Sulfur Contamination and Environmental Effects: A Case Study of Current SO2 Industrial Emission by Biomonitoring and Regional Post-mining hot-spots
Abstract
The presence of sulfur in the environment is an important macroelement for plant growth but becomes harmful in excessive amounts. The previous century saw rising levels of high SO2 concentrations (stemming from fossil fuel combustion) and wet deposition from acid rain, causing the intensification of forest die-back. Air pollution can be controlled or measured by biomonitoring. Despite recent reductions in SO2 emissions, urban and industrial areas are still at risk from high sulfur contamination. Open-cast lignite and sulfur borehole mining play a pivotal role in the regional scale of ecosystem contamination and acid mine drainage. Consequently, these aspects are unique for assessing the impact of extreme S contamination on soil properties changes, the vegetation effect, and biogeochemical cycles. We presented i) current SO2 pollution based on S concentration in pine needles, and ii) a comprehensive study of soil properties, as well as plant reactions to excessive sulfur concentration in the restored forest ecosystem of a former sulfur mine.
1. INTRODUCTION
Sulfur (S) is a macro element necessary for the growth and proper development of plants, and its concentrations in plant foliage tissues which indicate optimal growth typically range from 0.1–0.5% of a plant’s dry weight [1, 2]. Plants absorb sulfur mostly in the form of SO2- by their aerial (or, above ground) parts and by their roots in the form of SO42- [2]. Sulfur in plants is responsible for synthesizing the amino acids cysteine, cystine, and methionine, as well as metabolites (e.g., biotin, thiamine, and glutathione)-all of which are contained in S. In case of sulfur deficiency (currently more frequent than excess, especially in agricultural areas) [3-5] plants see a reduction of root growth and leaf area, and decreases in chlorophyll and protein concentration (chlorosis) [2]. However, high/excessive sulfur concentrations also affect the root system (possibly through shifting carbon allocation) and reduce foliage. Excesses also cause leaf stomata disturbances and premature senescence, resulting in the thinning of tree crowns, deformed canopy shapes, limited growth, and a decrease in nutrients [2, 6-9]. Dust from industrial emissions settles on leaves and disturbs the processes of photosynthesis and transpiration [8-10]. Excessive sulfur deposits increase the number of nutrients leaching into the soil. For instance, the displacement of the base cations Ca2+ and Mg2+ from the sorption complex consequently leads to soil acidification. In acidic soil, trace elements harmful to soil organisms-and which subsequently disturb biogeochemical cycles and vascular plant nutrition increases-are mobilized [11]. The acidification of soil can also lead to the release of toxic Al, thereby detrimentally affecting fine root growth and inhibiting Ca, Mg, and K uptake [8]. Sulfuric pollution can result in nutrient deficiencies and increase the effects of natural stressors, such as physiological drought, frost, pests, and fungal diseases [6].
The most common source of sulfur pollution is sulfur dioxide (SO2). Not only is SO2 detrimental to humans, but SO2 and its products (sulfate, sulfuric acid) affect the environment and agricultural areas on a regional and global scale (e.g., acid deposition, direct and indirect radiation forcing) [12]. SO2 occurs naturally, predominantly from volcanic activity and biological and photochemical production in oceans’ volatile sulfur gases. It is also released, to a lesser extent, by forest fires, sulfur springs, and sea salt [12, 13]. Although natural SO2 is assumed to account for approximately one third of total SO2 emissions, scientists are still developing more accurate measurement methods, such as using spectrometer systems to accurately quantify both high and low SO2 column densities [13]. Most sulfur emissions come from anthropogenic sources. It is estimated that anthropogenic sources account for more than 70% of global SO2 emissions, half of which result from fossil-fuel combustion-particularly hard coal and lignite, which typically consist of 1.0–3.0% sulfur in the form of pyrites and marcasites. Additionally, S contamination results from petroleum refining, the smelting of sulfidic ores in the production of heavy metals, and the production of sulfuric acid, paper, and sulfur [6, 12, 14, 15].
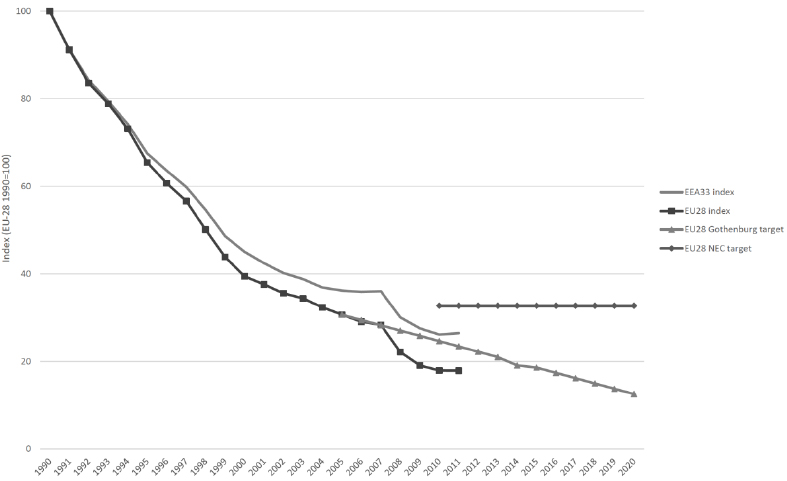
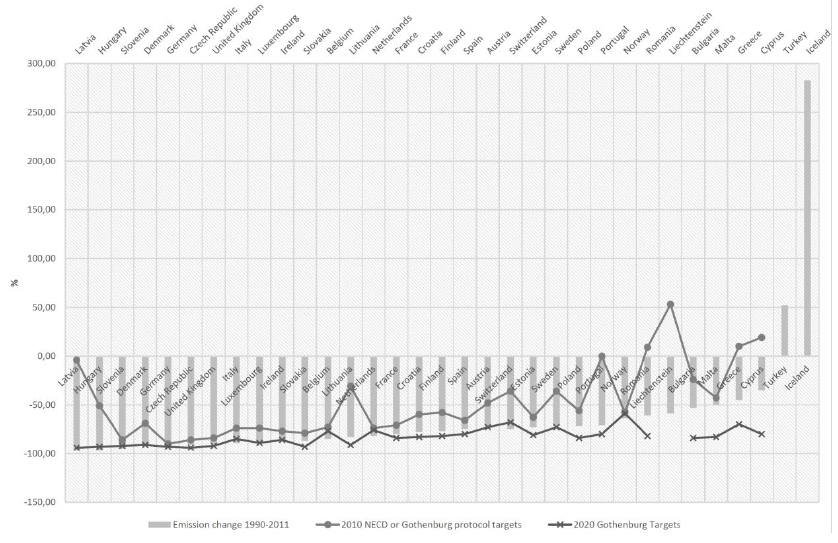
SO2-responsible air pollution may well be one of the most significant factors behind forest decline in the northern hemisphere [8]. Acid deposition results in a high concentration of SO2 in the air. In 2000, the US Environment Protection Agency observed highly acidic precipitation with a pH of below 4.3. Acid depositions damage forests by acidifying soil (an approximate one-point pH decrease was noted in Germany, Sweden, China) and disturbing the mineral management of trees [16]. In 2000, China (one of the world’s largest emitters of SOx – SO2, SO3) estimated that acid deposition and its effects were responsible for a financial loss of 1.77% of the national GDP [17, 18]. In industrial and urbanized areas, sulfur deposition can be sufficient for proper plant yields [2]. However, in the past decade, SO2 emissions have decreased as a result of EU regulations. The EU introduced SO2 emissions limits (published in their directives) for sulfur contents in certain liquid fuels [19]. Consequently, energy-related sectors have switched from high-sulfur solid and liquid fuels to low-sulfur fuels, such as natural gas, and have established industrial facilities to implement abatement technologies for flue gas desulfurization. Europe has benefited from these actions. Indeed, from 1990 to 2011 (last published data, actualized in 2015) [20], SOx emissions have decreased by 74% (Figs. 1 and 2) [19]. The EU-28 Member States-as well as Liechtenstein, Norway, and Switzerland-have reduced their national SOx emissions below the level of the 2010 guidelines set by the National Emission Ceilings Directive (NECD) [19].
While still the world’s second largest emitter, China has also achieved a significant reduction since 2007 (from 36.6 to 8.4 megatons as of 2016) [18]. In 1996, China first included the control of SO2 emissions in its National Five-Year Plan (FYP), which required that SO2 emissions in 2000 should be under 24.6 Mt [17]. According to the recent Air quality in Europe Report [21], SO2 concentrations are generally well below the limits for the protection of human health, although daily excesses of the WHO daily mean guidelines persist. Realizing that climate change and environmental degradation pose a threat to Europe and the world at large, the EU is currently furthering its strategy through the so-called “Green Deal.” This strategy assumes that net-zero greenhouse gas emissions will be achieved by 2050 (through the decarbonization of the energy sector), economic growth will not depend on resource use, and hopes for fair action in this context (i.e., no person or region will be left behind).
Sulfurous and acidic soils occur most frequently in industrialized regions, most especially in the USA, Canada, and southern China [22]. Areas most often associated with abnormally high sulfur concentrations (of above 0.8%, or pH levels of 1.7–3.5) tend to be located in the vicinity of sulfur mines, sour gas processing plants, and former lignite coal mining sites [16, 22-25]. Furthermore, areas affected by lignite mining, connected with pyrites and marcasites, and iron and gold mines, are often connected with Fe, Al, or Fe2(SO4)3 as well as with sulfur contamination [23, 26, 27]. However, areas with high sulfur concentrations are relatively rare-indeed, the reverse trend in agriculture has been observed, but the lack of control over the industry responsible for the introduction of sulfur to soil may well result in significant environmental transformations. In order to effectively restore the environment (or ecosystem), each ecosystem should be examined comprehensively (soil, water, vegetation, and fauna, as well as their components).
Examples of soil heavily contaminated with anthropogenic sulfur (to a globally unprecedented degree) would include areas where sulfur deposits have been mined using the Frasch borehole process (the underground melting of sulfur). This method was used in sulfur mining in, among other areas, the US (until 2000) and Iraq (until 2003). The process is still conducted in southern Poland at the Osiek sulfur mine [25]. The Tarnobrzeg region of southern Poland has one of the largest known sulfur deposits in the world (Piaseczno-Machów-Jeziórko-Jamnica deposit). Sulfur has been mined there since the 1950s, first through the opencast method, and later by the Frasch process [28]. Restoring the (sulfur-contaminated) areas exploited by the Frasch process is fraught with difficulties, yet such areas provide excellent case studies for research on the geochemical changes of mineral sulfur in the ecosystem and the reaction of microorganisms and plants to excess concentrations of this element in the soil.
In this chapter, two important issues for global sulfur emission and its environmental effects, namely natural or industrial SO2, and sulfur contamination hot-spots (excessive sulfur in soil, and surface and water contamination) where vegetation must function under environmental stress was exemplified. Research into these issues is vital and can provide a unique opportunity to supplement the knowledge concerning ecosystem reaction to environmental stress in the broad context of assessing the dynamics of woodland restoration.
2. BIOMONITORING PAST AND PRESENT SO2 EMISSION AND AIR POLLUTION THROUGH EXAMINING S CONCENTRATION IN SCOTS PINE NEEDLES-A CASE STUDY IN POLAND (CENTRAL EUROPE)
One way to assess air pollution is to measure the accumulation of contaminants in the tree assimilation apparatus of plants [29-31]. Studying the content of a contaminant in plant tissues is known as bioindication. Bioindicators can be species characterized by long life cycles and tend to have specific reactions (both constant and repeatable) to particular changes in the environment. The most positive features of biomonitoring plants are their slow growth, lack of epidermis (e.g., lichens), their status as perennial organisms, and their characteristic ability to accumulate elements exceeding their nutritional requirements [32]. Moreover, their photosynthetic apparatus is sensitive to air pollution, meaning that pollution levels are easy to observe [31, 33]. Plants take in air pollutants through the absorption of particulate matter by the leaves and the deposition of aerosols [33, 34]. Among biomonitoring, the European blueberry (Vaccinium myrtillus L.) is one of the most commonly used in monitoring air quality and its pollution. Mosses and lichens are also commonly used in biomonitoring due to their lack of roots (compared to higher plants), meaning that they collect pollution predominantly from the air [35]. The main advantage of using trees in biomonitoring is their longevity, thereby enabling a systematic repetition of the investigation using standardized sampling and analytical techniques for comparative monitoring [14]. Scots pines (Pinus sylvestris L.) are frequently used in the bioindication of SOx air pollution [36, 37]. The measuring of air pollution (including sulfur and heavy metals concentrations) using bioindication, and more precisely pine needles as bioindicators, was recommended by the United Nations Environmental Program as a standard environmental assessment method [14]. Also, other institutions such as ICP-Forests, State Environmental Monitoring use and recommend plant bioindicator as an alternative to (the more expensive) technical monitoring methods [35]. Pinus sylvestris L. meets the biomonitoring criteria because of its low ecological tolerance to sulfur compounds contained in the atmosphere, as well as its wide geographical range and habitat spectrum [14]. Additionally, Scots pines are evergreens and thus accumulate air pollution over several years. Further to this, their age can be easily determined [37]. The worldwide presence of pines further qualifies them as effective biomonitors as they allow for a global understanding of pollution levels and compare studies conducted on one species [30]. Gaseous pollutants enter the leaf mesophyll, enabling the assessment of the degree of SO2 air pollution based on the S value concentration in leaves or needles. Pine needles have also widely been used to determine the long-term pollution levels of PAHs, PCBs, OCPS, POPs, trace elements, and sulfur [37].
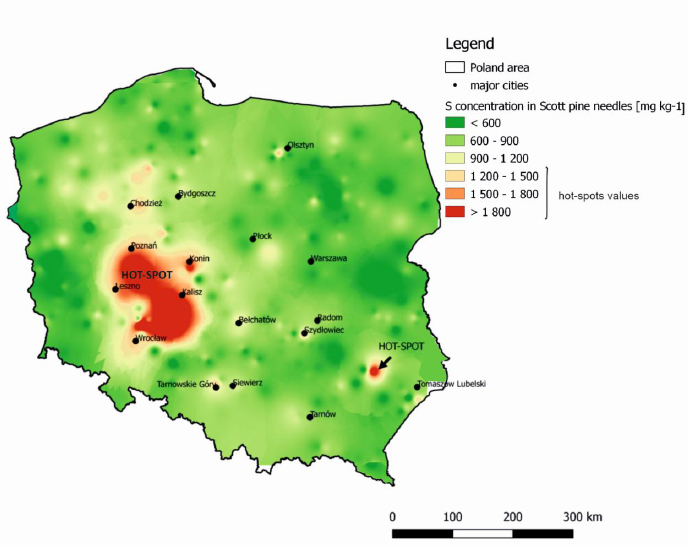
Based on the sulfur concentration found in pine needles, the current SO2 air pollution in Poland, as influenced by anthropogenic pressure, has been able to be determined. Pine stands in 295 monitoring sample plots (located in afforested sites in Poland) were measured. On each plot, samples were collected in 3 soil horizons (0–10cm, 10–40cm, 40–100cm), soil organic layers (+5-0 cm), and Scott pine foliage (current-year needles). The map of spatial variability of S in Poland was thus developed based on the S concentration in pine needles. The results showed that the mean S concentration in pine needles was 854.8 mg kg-1 (ranged from 537.5 to 2,343.2 mg kg-1) in dry mass. The pine concentration in the studied habitats showed a very poor supply of sulfur, i.e., grade I (from 660–990 mg kg-1) when using Heinsdorf’s (1999) assessment criteria for the ranges of tree nutrition [38]. It should be remembered that Heinsdorf [38] provided values for the supply of trees in postindustrial sites. Other authors, such as Baciak et al. [36], provided supply levels of Scots pine needles in less industrialized areas (characterized by lower levels of air pollution) as being between 300 to 1,200 mg kg-1, and from 6,000 to 10,000 mg kg-1 in highly industrialized areas. ICP-Forest data indicated S content in pine needles in Europe ranges between 790 mg kg-1 to 1,520 mg kg-1 in current-year needles, and from 1,050 mg kg-1 to 1,470 mg kg-1 in 1-year needles. According to Fober et al. [39], the nutrient supply of trees in natural growth conditions shows normal growth and development (without deficiency symptoms) when S content in photosynthetic apparatus is 300 mg kg-1 S in dry matter. As such, the levels found in this case study seem to be sufficient and, somewhat crucially, not a cause for alarm. However, based on the study, it is easy to notice that Poland contains areas where there is clearly a higher sulfur concentration in the pine assimilation apparatus. The highest sulfur content in pine needles was noted in western Poland (from 1,300 to 2,300 mg kg-1 S-sulfur supply in these areas is, according to Heinsdorf, low or sufficient [38]). High concentrations of S in pine needles were recorded mainly in highly urbanized areas-for instance, near Poznań, Wrocław, and Olsztyn (1,321 mg kg-1 S). This was followed by highly industrialized areas in the vicinity of SO2 emitters related to the mining, processing, or energy and mining industries. As seen in (Fig. 3), this would include areas in the Upper Silesia region, such as Tarnowskie Góry, Siewierz, and the mining complex at Ostrów Wielkopolski KGZ Żuchlów.
From the above, it was concluded that the level of SO2 in the air-information on which was obtained through the S concentration in pine needles-is fortunately unalarming. Moreover, based on the research conducted, it would be possible to determine areas with higher S content in pine needles-and therefore higher emissions. Likus-Cieślik et al., (2019) [40] assessed the content of S in pine needles in the context of measuring the improvement of air quality with previous research conducted in the 1980s. They found that the current air quality has improved compared with the study period. There are many possible explanations for this improvement, including EU regulations on fuel transitions, such as shifting to natural gas, and enhancing or developing technology aimed to reduce flue gas desulphurization in industrial facilities.
3. HOT-SPOTS WITH EXTREMAL SULFUR CONTAMINATION-A CASE STUDY ON A FORMER SULFUR MINE
3.1. Case Study
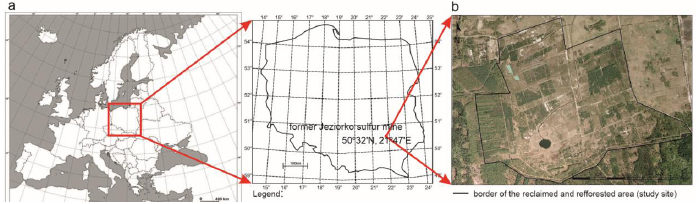
The case study examined the former Jeziórko sulfur mine (FJSM) in southern Poland, located at 50º32’34 N, 21º47’46 E (Central Europe; (Fig. 4)).
The FJSM covered a total area of over 2,140 hectares. Reclamation initiatives began in 1993, and over 700 ha were reforested, of which 216.5 hectares-where the research was conducted-are currently managed by the Nowa Dęba Forest Inspectorate, State Forest National Forest Holding (Fig. 4). This research area was chosen as it afforded comprehensive ecological research. Reclamation treatment consisted of removing most of the mine’s infrastructure (e.g., mine wells and pipelines, though some technical roads were left), improving hydrographic conditions, landscaping, the neutralization of sulfurous and excessively acidic soil using sludge lime (average 400–500 Mg ha-1), fertilization (70 kg ha-1 P2O5, 60 kg ha-1 K2O), and the sowing of grass seeds [22]. Following this came the planting of tress: mainly one-year-old Scots pine seedlings (Pinus sylvestris L.) with an admixture of silver birch (Betula pendula Roth) and boreal oak (Quercus rubra L.) [22].
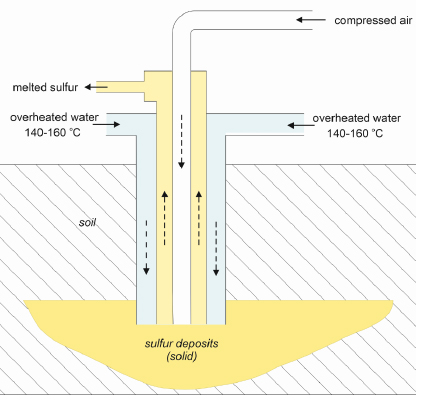
In the FJSM, sulfur was extracted using one of two available methods-the borehole method, also known as the underground melting method or the Frasch process (named after its inventor) [22]. This process was environmentally damaging in that it led to soil and groundwater acidification and Acid Mine Drainage (AMD)-the two most significant transformations stemming from underground sulfur extraction [41]. The Frasch method involves injecting superheated water (at a temperature of between 140–160°C) into a sulfur field. This injection leads to sulfur being melted underground, allowing it to be pumped to the surface in liquid form (Fig. 5) [22]. The most environmentally significant outcome resulting from the mining method was strong soil sulfidation (reaching a level of 4%) caused by the leaking of liquid sulfur into local hot-spots [25]. Plants, such as forest tree species, were introduced into conditions affected by sulfur exploitation-areas entirely transformed and different from their natural habitats. As such, these types of areas are difficult to reclaim. After the end of the neutralization and reclamation process, there is a tendency for these areas to collapse or become flooded within the years to come (between a few or a dozen years later), thereby revealing once more the negative effect of excess sulfur concentrations on vegetation.
Currently, almost 30 years after reclamation efforts started, forest stand in the research area was about 24 years [42].
In the research conducted between 2015–2019, the FJSM area was comprehensively studied. In order to effectively restore the environment (or ecosystem), each ecosystem should be examined comprehensively (soil, water, vegetation, and fauna, as well as their components). For this reason, we decided to conduct a comprehensive study of the object as a whole (soil, vegetation tramp, etc.), which for years was under strong anthropogenic pressure connected with mineral sulfur ores. Indeed, the spatial distribution of the contamination area presented the specificity of sulfur-contaminated soils in detail and meticulously studied the impact of sulfur mines on the surface waters of the studied area and vegetation was inventoried (introduced as part of reclamation efforts or arising naturally). The most important results and conclusions are presented in this paper.
3.1.1. Soil Parameters and S Contamination Spatial Variability
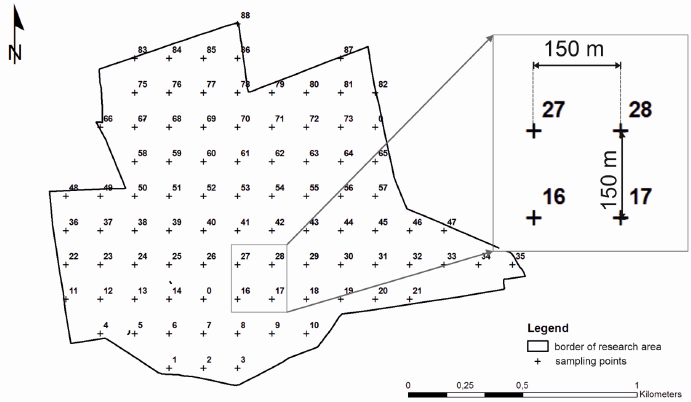
To investigate the spatial variability of sulfur contamination distribution in reclaimed and reforested post-sulfur mining sites, the research area (squares whose sides measured 150m) was divided into 88 sampling points (Fig. 6). The first step involved identifying points on the map using ArcGIS software (ESRI) and then targeting and stabilizing them using the Garmin GPS receiver (GPSMAP® 60CSx).
In the soil sample collected from the top layer (0–20 cm), the following chemical parameters were determined: pH potentiometrically in 1 mol L-1 KCl (maintaining a ratio of soil–solution of 1:2.5), EC (soil ratio–solution of 1:5), and SOC, NT, ST with the TruMac Leco CNS analyzer. The degree of S contamination, pH, and electrical conductivity (EC) using ArcGIS (ESRI) were plotted. Due to a lack of data concerning S contamination levels in international sources, the degree of soil sulfur contamination was assessed on the basis of the Polish guidelines laid out by the Institute of Soil Science and Plant Cultivation [44].
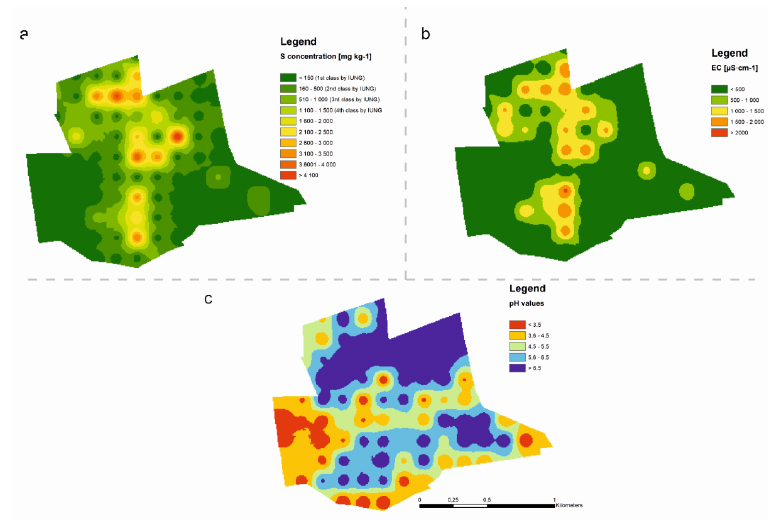
As illustrated in Table 1 and (Fig. 7c), a range of differing pH levels of soil was found. 49% of sampling points had acidic pH levels (pHKCl from 2.7 to 6.5). The soil EC values were within acceptable levels and ranged between 15 to 2,080 μS cm-1 (Table 1, Fig. 7b). Only in two sampling points did the EC value exceed 2,000 μS cm-1 (as per FAO guidelines) [45], considered the amount at which the growth and yield of sensitive plants may be limited. The sulfur concentration in topsoil horizons-similar to pH-had a wide range of values (10–45,740 mg·kg-1; Table 1 (Fig. 7a). Soil pH and sulfur concentration was not correlated. However, a positive correlation between soil sulfur concentration and soil EC was found (r=0.80). At soil sulfur concentrations of up to 2,000 mg kg-1, EC ranged from 15 to 314 μS cm-1. At soil sulfur concentrations exceeding 2,000 mg kg-1, EC ranged from 837 to 2080 μS cm-1 (Fig. 5). The natural concentration of sulfur (according to the Institute of Crop and Soil Fertilization guidelines; Kabata-Pendias et al., 1995) was characterized by 35% of the analyzed area. The high concentrations (slight contamination) and very high concentrations (heavy contamination) of sulfur in 12% and 26% of the researched area were observed, respectively (Fig. 7c).
Finally, the scale of high sulfur concentration on FJSM was relatively small (hot-spots occurred in only 2% of the researched area). The most contaminated areas were predominantly concentrated in the northern and central parts of the site.
| Soil Texture According to USDA | pHKCl |
EC µS cm-1 |
ST mg kg-1 |
|
| Mean (range) | S | 5.1 (3.3–7.6) |
92 (16–314) |
212 (10–1,099) |
| Mean (range) | LS | 4.4 (2.6–7.5) |
222 (15–1,573) |
2,185 (0–25,575) |
| Mean (range) | SL | 5.6 (2.8–7.5) |
412 (21–2,080) |
5,002 (10–40,805) |
| Mean (range) | L | 6.5 (3.8–7.3) |
1,332 (27–2,000) |
15,388 (56–27,930) |
| Mean (range) | SiL | 7.0 (6.8–7.1) |
1,625 (1,212–1,940) |
35,731 (32,096–45,742) |
3.1.2. Surface Water Chemistry And Acid Mine Drainage Risk Assessment
Ground and surface water are important biotic elements (perhaps even as much as soil) of reclaimed ecosystems [46]. The abundance of water in biogenic ions is a key habitat-forming element and directly impacts the nutritional management of vegetation introduced as part of reclamation efforts. The parameters of water discharged from post-mining areas differ significantly from those of natural surface and ground waters. Particularly within sulfated areas (e.g., postmining lignite, sulfur areas), the phenomenon of AMD frequently occurs [47].
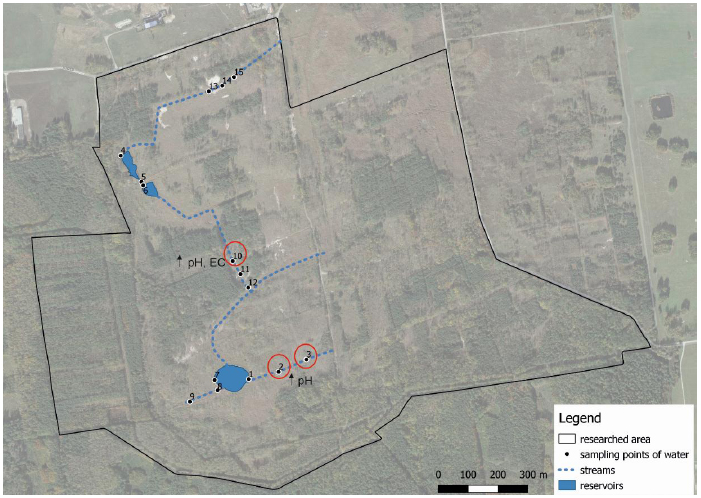
Surface water samples were collected from 15 monitoring points (including reservoirs and watercourses) within the FJSM (Fig. 8) in summer, autumn, winter, and spring sessions (2017–2018). pH, EC, and ionic composition (Ca2+ Mg2+, Na+, NO3-, SO42-, Cl-, HCO3-) could thus be determined. The spatial variability for the mineralization and hydrogeochemical classification according to Szczukariewo-Prikłoński classifications was evaluated. It was assumed that sulfur significantly influenced the chemistry of surface waters in the reclaimed area, and that the neutralization of sulfated soils with the use of lime impacted the chemical changes and hydrochemical parameters of surface waters. It was found that the mean pH value from the readings for all measurements, and the mean value found in individual seasons, ranged from neutral to slightly acidic. However, it was found hot-spots in the monitored area where the pH levels were significantly low (between 2.6–3.1). Further, no differences in pH between the seasons were observed. The electrolytic conductivity, on average, for the whole research period was 1,797 µS cm-1 (from 1,083–3430 µS cm-1). Referring to the current standards (in which only one includes EC) [48], high EC values (i.e., EC>1,500 µS cm-1) indicative of water salinity in 82% of the samples were found. The content of SO42- ranged from 472 to 1,503 mg L-1. The concentration of sulfate ions in particular research seasons (in all sampling points) was between 4–12 times higher than current standards [48] assume for high quality waters (i.e., SO42– <138.5 mg L-1). The general condition of water mineralization in the study area was considered to be high. The mean value of mineralization from the measurements for the entire monitoring period was 1,489 mg L-1. The largest share consisted of sulfate ions (63%), followed by calcium ions (22%). The high content of SO42– ions was associated with the high sulfation of soil, and the increased concentration of Ca2+ ions was associated with the effect of using large doses of flotation lime for neutralization during land reclamation. The main factors contributing to the poor condition of the examined surface waters were the extremely low pH values, high EC levels, and the high concentration of SO42– in certain sampling points. The concentration of the remaining ions in the surface waters of the study area was relatively low and had no effect on lowering the overall chemical quality. SO42– and Ca2+ ions determined the chemistry and hydrogeochemical classification of waters-indeed, as per the Szczukariew-Prikłoński classification, water predominantly was classified as sulfate-calcium (58%). However, these are not natural mineral waters, but surface waters were significantly transformed through anthropogenicity. In conclusion, a direct relation between water chemistry and the specific geochemical system of the anthropogenically transformed environment as a result of sulphation (caused by intense exploitation of sulfur deposits) and the effects of reclamation-based liming were found. Despite high pH values, the post-mining area must be monitored due to the constantly changing ecosystem conditions.
3.1.3. The Relationship between Sulfurous Soil And Vegetation
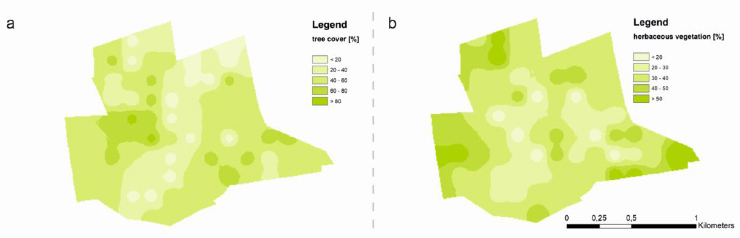
According to research on the spatial distribution contamination of the FJSM, vegetation covered a range of 10 to 70% of the research area. Trees covered 0 to 90% of the surface area (Fig. 9a). The lowest tree surface coverage was found in the northern part of researched area, and in the “belt” of northeastern to southwestern sections (Fig. 9a). No significant correlations between soil properties and tree cover were found. The lowest herbaceous vegetation coverage percentages (2 on the cover scale-e.g., plant cover between 5–25% of 1 m2 area) were observed in the central part of the sample area (Fig. 9b), where sulfur concentrations in the soil were extremely high (see subchapter 3.1.1 and (Fig. 7a)). Herbaceous vegetation, like tree cover, was not correlated with pH, soil organic carbon, or soil sulfur concentration. It can see from field observations that the reasons for the northeastern areas’ low tree coverage are due to subsidence and high water levels during periods of high atmospheric precipitation.
3.1.4. Foliage Chemistry and Macronutrient Supply at S Contaminated Sites
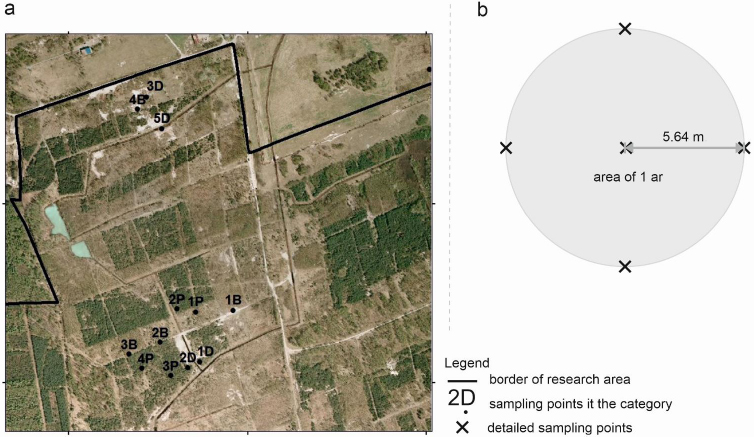
The next step, following the recognition of the FJSM’s variability, involved determining land cover classes using orthophoto screen vectorization in the ArcMap ArcGIS 10.2 (ESRI, Redlands, CA, USA) to conduct micro-scale (detailed sample plots) research in various land cover classes (or, categories). Detailed sample plots in three categories were selected (two afforested and one bare soil; (Fig. 10)). These included:
● P and B categories-successfully reclaimed and reforested site categories (where P=pine and B=birch stands)-due to these species being the most often used in afforestation processes (four plots each);
● D category-degraded category with no plants (bare soil) or little surface coverage with herbaceous vegetation or trees (four plots).
Soil samples on 1-ar (r=5.64 m) circular surfaces from 0–20cm, 20–50cm, and 50–100cm horizons were collected. Five points in a regular pattern-1 point in the middle and 4 points 5.64 m from the inside in the north, east, south, and west towards were arranged. Once done, one mixed sample from one sample plot was taken (Fig. 10b).
Basic soil parameters (pH, EC, ST, SOC, NT) according to the methodology given above were analyzed. In order to understand the plant-soil relationship, the degree of herbaceous plant coverage on the 1-ar sites according to species, the Braun-Blanquet scale, as well as the measurement and classification of tree parameters were determined (crown cover, diameter at breast height (DBH), and height (Ht)). Moreover, samples of vegetation (overground tissue of Calamagrostis epigejos Roth, the most commonly occurring plant) and tree foliage of Scots pine needles in the P category (one-year-old (Pc) and two-year-old (Pc+1)), and common birch leaves in the B category were collected, so as to analyze the plant chemistry and mineral nutrition of the FJSM. Plant tissue from five sample trees in the southwestern and middle sections of tree crowns on each sample plot was collected (Likus-Cieślik and Pietrzykowski, 2017). Next, one mixed sample from one plot was made. The plant tissue at 65°C was dried, and ground and prepared them in order to determine the content of nitrogen (N) and sulfur (S) with LecoTruMac®-CNS, and K, P, Ca, and Mg following mineralization in a mixture of HNO3 and HClO4 acids (in a ratio of 3:1) using an ICP OES ICAP 6000 Series spectrophotometer (Thermo Fisher Scientific).
The highest S concentration in birch leaves (mean: 1,954 mg kg-1) was found. S concentration in Pc and Pc+1 were lower: mean 1,272 mg kg-1 and 1,221 mg kg-1, respectively. Significant differences in S concentration between the species were found. Based on such data, it can be concluded that the supply of Ca, Mg, K in trees is suitable, while N (Table 2) is a deficit nutrient.
A deficit of nitrogen and phosphorus (P) in the above-ground parts of Calamagrostis epigejos Roth was noted in all distinguished categories (Table 3).
The highest concentration of sulfur in Calamagrostis epigejos was observed in the P category (mean:2,249 mg kg-1), but S concentration in plant tissue was statistically similar in all categories (Table 3). It was surprising that higher amounts of sulfur were not observed in the above-ground tissue parts of plants in most sulfurized soil categories (D) compared to afforested areas (which displayed lower soil sulfur concentrations).
| Category and Research Material |
N % |
P mg kg-1 |
Ca % |
Mg mg kg-1 |
K % |
S mg kg-1 |
N:P | |
| B | 1.58–1.89 | 1695.8–2,969.3 | 1.15–1.63 | 1,039.9–2,073.1 | 0.68–1.07 | 1,218–2,626 | 7.6 | |
| P | Pc | 1.05–1.30 | 1,221.3–1,454.3 | 0.25–0.44 | 645.0–765.5 | 0.46–0.56 | 1,054–1,459 | 8.3 |
| Pc+1 | 1.05–1.81 | 970.6–1,111.8 | 0.52–0.93 | 687.5–751.5 | 0.48–0.53 | 955–1,513 | 10.6 | |
| Category |
S mg kg-1 |
N % |
P mg kg-1 |
K % |
Ca % |
Mg mg kg-1 |
N:P | |
| P | range | 2,087.8–2,383.0 | 0.71–1.09 | 1,235.3–1,407.3 | 0.82–1.25 | 0.20–0.50 | 603.4–932.5 | 6.9 |
| B | range | 1,406.6–2,084.4 | 0.56–0.99 | 749.2–1,416.3 | 0.37–0.98 | 0.15–0.33 | 296.8–633.1 | 6.7 |
| D | range | 790.6–2,238.5 | 0.40–0.72 | 519.3–1,618.3 | 0.23–0.91 | 0.09–0.28 | 175.1–499.5 | 7.7 |
3.2. Simulation of Soil Chemistry Changes and Assessment of Contaminant Leaching and Bioremediation Potential Under Controlled Conditions
To investigate biogeochemical transformations of mineral sulfur in the soil environment, a 12-week experiment under controlled conditions was designed. Two types of soil substrates were used: less contaminated (LS) with a mean of 5,090 mg kg-1 S, and high contaminated (HS) with a mean of 42,500 mg kg-1 S, to which birch or pine litter was added (LS-B/HS-B; and LS-P/HS-P, respectively), and a control substrate (no litter; LS-c/HS-c). The composites with 100ml of distilled water were rinsed twice a week and filtered the water once a week throughout the course of the experiment.
At the beginning of the experiment, the concentration of the soil samples grain size, pH, EC, St, SOC, Nt, Ca, Mg were determined. The litter samples for the pH, St, Nt, C, Ca, Mg, as well as calculated the C:N ratio were determined. After 12 weeks, the same properties of the substrates (experiment grain size) were again analyzed. The pH, EC, dissolved organic carbon (DOC), Nt, Ca, Mg, and St of the filtrated water were determined (soil solution).
3.2.1. Sulfur Leaching and Biogeochemical Transformation
After 12 weeks, it was found that rinsing and litter application lowered sulfur concentration in highly contaminated substrates (HS 42,521 mg kg-1 at the beginning; HS-c 35,634 mg kg-1, HS-B 33,247 mg kg-1, and HS-P 34,157 mg kg-1 at the end of the experiment; Table 4). However, the level of S concentration in HS composites was still very high. In the low contaminated substrates (LS) lowered sulfur concentration by rinsing was not observed. In LS composites, it was found that rinsing could significantly reduce the substrate’s EC (LS 5,090 mg kg-1 at the beginning; LS 1.87 mS cm-1, LS-c 0.39 mS cm-1, LS-B 0.59 mS cm-1, and LS-P 0.23 mS cm-1 at the end of the experiment; Table 4). Pine litter application decreased EC and increased the pH of the less contaminated substrate. The substrate pH remained at low phytotoxic levels (i.e., below 3.0), resulting in the low biological activity of the composites. Birch litter application increased N and Mg leaching, thereby indicating the possibility of an intensification of soil-forming processes in contaminated sites (Table 5).
During 12 weeks, it was observed that higher sulfur values in the soil solution were observed from the LS substrate at the beginning of the experiment than for HS (Fig. 11). This may indicate that it is difficult to leach sulfur from extremely polluted areas (in the case of the experiment, the sulfur level was over 40,000 mg kg-1). However, in the case of LS it was observed that high amounts of St are washed out in weeks 1 and 2 of the experiment, and after week 3 there is stabilization and a similar amount of St was leached out by the end of the experiment. In the case of the HS substrate, a downward trend was observed, but there were no such large differences in the amount of leached sulfur, at the beginning and at the end of the experiment, from the substrate to the soil pollution as in the case of LS (Table 5 and Fig. 11). It was observed that despite a significant reduction of St content in the HS composites, the degree of sulfur contamination was still very high and phytotoxic for plants and microorganisms. Similar regularities were observed in the case of EC. Lower values of the pH of the soil solution were recorded at the beginning of the experiment (week 1) for leachate from the LS substrate (Fig. 11). After 12 weeks, the pH values for LS were higher than at the beginning of the experiment (the pH increased by 0.7 to 2 pH units the most for the pine litter added).
| Properties | LS | LS-c | LS-B | LS-P | |
| pH | 2.1a | 2.6bc | 2.5bd | 2.9e | |
| EC | mS cm-1 | 1.87a | 0.39b | 0.59c | 0.23d |
| St | mg kg-1 | 5,090a | 6,447a | 5,947a | 6,178a |
| SOC | g kg-1 | 3.22a | 2.89a | 2.97a | 3.09a |
| Nt | 0.03a | 0.02a | 0.03a | 0.02a | |
| Ca | 7.06a | 0.07b | 0.06b | 0.38b | |
| Mg | 0.09ac | 0.04b | 0.04b | 0.05b | |
| HS | HS-c | HS-B | HS-P | ||
| pH | 2.5bc | 2.6c | 2.3d | 2.5bc | |
| EC | mS cm-1 | 2.59e | 2.53e | 2.98f | 2.58e |
| St | mg kg-1 | 42,521b | 35,634c | 33,247c | 34,157c |
| SOC | g kg-1 | 7.78b | 7.23b | 7.80b | 7.20b |
| Nt | 0.16b | 0.19bc | 0.22c | 0.18b | |
| Ca | 11.68c | 4.21de | 2.95d | 5.99de | |
| Mg | 0.11a | 0.08c | 0.11a | 0.11a | |
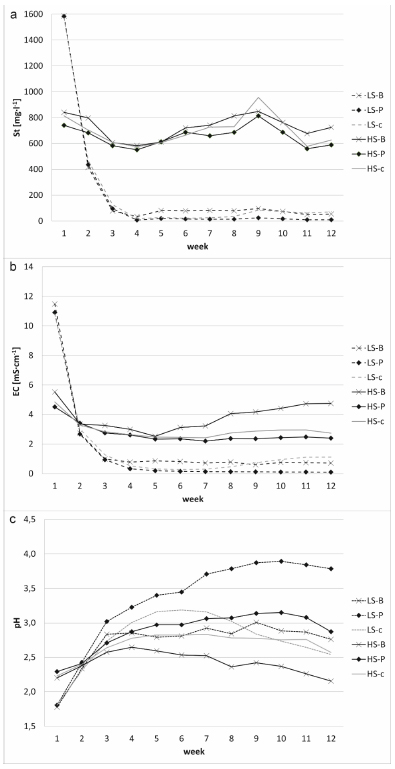
In the case of HS substrate, the pH of the filtrates at the beginning and the end was similar (the pH increased by a maximum of 0.6 pH units of HS-P; Table 5, Fig. 11).
Table 5.
| Properties | - | LS-c | LS-B | LS-P | HS-c | HS-B | HS-P |
| pH | s | 1.8a | 1.8a | 1.8a | 2.2a | 2.2a | 2.3a |
| f | 2.5b | 2.8b | 3.8b | 2.6b | 2.2a | 2.9b | |
| EC mS cm-1 | s | 10.80a | 11.48a | 10.91a | 4.85a | 5.52a | 4.51a |
| f | 1.12b | 0.71b | 0.10b | 2.74b | 4.75b | 2.40b | |
| St mg l-1 | s | 1,570.8a | 1,585.9a | 1,583.3a | 814.3a | 841.4a | 741.0a |
| f | 71.0b | 53.7b | 9.6b | 625.7b | 725.4a | 588.0b | |
| DOC mg l-1 | s | 82.8a | 93.0a | 117.1a | 101.4a | 127.0a | 110.4a |
| f | 5.1b | 20.5b | 37.2b | 9.8b | 32.0b | 29.6b | |
| Nt mg l-1 | s | 14.7a | 18.1a | 16.4a | 5.7a | 7.7a | 6.5a |
| f | 0.5b | 1.5b | 1.2b | 0.4b | 2.6b | 0.8b | |
| Ca mg l-1 | s | 474.4a | 445.3a | 442.8a | 550.2a | 552.8a | 553.4a |
| f | 5.8b | 13.7b | 5.2b | 467.3b | 494.8b | 495.6b | |
|
Mg mg l-1 |
s | 2.2a | 7.9a | 8.0a | 0.01a | 1.6a | 0.9a |
| f | 0.0b | 0.7b | 0.1b | 0.01 a | 2.2a | 0.5a |
CONCLUSION
SO2 emissions are the most prevalent and widely researched sources of sulfur in the environment, which, thanks to all of the introduced regulations and restrictions imposed on EU countries (and others) have resulted in a reduction of SO2 air pollution. These observations were confirmed in our studies with the use of Scots pine as a bioindicator, indicating air pollution with this gaseous compound. This was confirmed by the studies we conducted in 2015-2016 (the years when the samples of needles were taken). The results of our studies were compared to the available data from the 1980s - we found that current air quality has improved compared with the previous study period. It can be concluded that the reasons for the improvement of the air were the regulations concerning the emission of gaseous parts, mentioned in the introduction in many countries, and the gradual process of abandoning fossil fuels (limiting coal extraction), but sulfur (S) is still an important element in the environment. In the previous century, S was an element that marked the combustion of fossil fuels, and currently, there is a significant improvement in the quality of the environment in terms of the presence of this element in the air. The highest sulfur concentrations were observed not in areas related to the extraction of even coal, but in highly urbanized places, near large urban agglomerations.
However, on the regional scale, even though these areas are not so significant in the area, the presence of sulfur and its high concentrations are an example of a long-term negative environmental effect of previous exploitation epochs. In spite of great efforts and outlays in the implementation of reclamation treatments, borehole sulfur extraction in the studied area has led to the emergence of hot-spots of very high concentrations of sulfur in the soil (as high as 45,000 mg kg-1), low pH (<2.0), and EC levels of even 2,080 μS cm-1. These properties undoubtedly impact aquatic ecosystems, which are characterized by a very high content of sulphates (geological origin-native sulfur ores) and calcium ions (as a result of the use of post-flotation lime/sludge lime in the reclamation process). Despite high concentrations of sulfate ions, acidic reactions (pH below 5) in the waters, possibly due to the aforementioned sludge lime, were observed. The chemical parameters of soil also impacted vegetation-in highly sulfurous or acidic areas, herbaceous vegetation, trees, and shrubs were either very rare or entirely absent. Such surfaces (bare soils) are termed degraded surfaces and tend to be classified as hot-spots. However, while these surfaces occupied only 2% of the scale of the tested object, we found them to significantly (and detrimentally) affect the soil through the undesirable reactions of vegetation. An interesting reaction of plants to excessive sulfur concentration is the strategy of blocking pollutant uptake from the soil (true exclusion or blocking of elements). This strategy is widely adopted by wood-small reeds, which are resistant to environmental stressors and, accordingly, could be used in the reclamation and remediation treatments of such soils typically displaying elevated salinity (or, EC) and sulfur content. The growth of trees in afforested areas indicated that, after careful acidity neutralization, newly introduced herbaceous plants and trees were characterized by relatively positive growth parameters and viability. A significant decrease of sulfur content in highly contaminated environments as a result of rinsing is certainly possible, but this is a lengthy process that cannot be achieved without neutralizing the soil detoxification effect. The controlled experiment and microbiological studies have shown that the soil substrates contaminated with sulfur are almost sterile and that the detoxification process on the most heavily contaminated soils will be extremely time-consuming. It is vital to make a thorough spatial reconnaissance of an area and efficiently plan activities before reclamation is undertaken. Moreover, one should also consider possible difficulties and obstacles related to further management of the area once reclamation has been completed. The extremely polluted by S area are a variety of ecosystems, and the effects of sulfur (the load that enters the environment) are difficult to predict, which makes such ecosystems very interesting, offering wide opportunities for researchers. At the moment, we know that the presence of sulfur strongly depletes these areas, affecting the vegetation, groundwater, and surface waters of the area. It would also remember that soil-particular its protection-should be treated as a matter of priority because soil, apart from its important role within an ecosystem (the environment of micro- and macro-organisms, a reservoir of many nutrients, etc.), is a protective filter against water contamination and the easy release of volatile elements into the air. Hence, heavily transformed areas should be subject to continuous monitoring, even though the restoration of a given area is considered completed.
CONSENT FOR PUBLICATION
Not applicable.
FUNDING
The study was financed by Ministerstwo Nauki i Szkolnictwa Wyższego within the framework of 2016-2020 Statutory Funds (DS ZEkLiR 3420, and BM 4444, BM 4544, A410). This research is a part of the developed research project for the dissertation of Dr. Justyna Likus-Cieślik DSc
CONFLICT OF INTEREST
The authors declare no conflict of interest, financial or otherwise.
ACKNOWLEDGEMENTS
This research is a part of the developed research project for the dissertation of Dr. Justyna Likus-Cieślik DSc.