All published articles of this journal are available on ScienceDirect.

Machine Learning for Improved Chlorophytum borivilianum Yield: ANNs and GPR in Macronutrient Modelling
Abstract
Introduction
The findings from the in vitro propagation research indicate that the concentration of macronutrients has the most significant impact on shoot organogenesis in plant tissue culture. The present study aims to predict the maximum degree of shoot organogenesis in Chlorophytum borivilianum using two sophisticated computer models: Artificial Neural Network Multi-Layer Perceptron (ANN-MLP) and Gaussian Process Regression (GPR).
Methods
The data were collected from experiments involving plant cultivation, using 60 explants in a laboratory setting. These experiments included 42 different combinations of macronutrient compositions of Murashige and Skoog (MS) media, and the results related to plant shoot organogenesis were used to train both Artificial Neural Network and Gaussian Process Regression models. The performance of the developed models was evaluated by comparing the observed and predicted output values based on the inputs.
Results
The results of the output modelling demonstrated that the GPR model exhibits superior accuracy compared to the MLP-ANN model. The model GPR has a percentage accuracy of 99.981 for the number of shoots and 99.885 for the shoot length. On the other hand, the ANN model has an accuracy percentage of 99.825 for the number of shoots and 97.582 for the shoot length. The partial dependence plot further illustrates the relationship between the concentration of macronutrients and the number and length of shoots.
Discussion
The concentration of macronutrients determines the structural and physiological changes that occur due to interactions between macronutrients and plants. The ANN and GPR models successfully relate the impact of macronutrient concentration on the growth indices. The growth indicators of Chlorophytum borivilianum show a beneficial response to higher doses of calcium chloride and magnesium sulphate. The models show that higher concentrations of potassium nitrate (grams per litre) negatively affect shoot growth, followed by ammonium nitrate.
Conclusion
The created GPR model can accurately estimate the number of shoots and shoot length by developing various formulations of MS media with variable macronutrient contents for the in vitro propagation of Chlorophytum borivilianum.
1. INTRODUCTION
Nowadays, the demand for herbal products is booming, reflecting keen interest in plant-derived remedies. Chlorophytum borivilianum, also known as Safed Musli, is a plant with high medicinal and industrial value [1]. It is used in the treatment of various conditions, including as a general sex tonic, aphrodisiac, antidiabetic, and remedy for physical weakness. This particular plant has numerous benefits, such as boosting the immune system, providing relief for pre- and postnatal issues, alleviating rheumatism and joint pain, and promoting lactation in breastfeeding mothers. Traditionally, it has also been used to address diarrhoea, dysentery, gonorrhea, and leucorrhea. In Ayurvedic literature, Chlorophytum borivilianum is highly regarded for its exceptional medicinal properties and plays a vital role in the creation of more than a hundred Ayurvedic formulations [2, 3]. The aforementioned information indicates a high demand for Chlorophytum borivilianum due to its rich content of beneficial medicinal compounds, including flavonoids, triterpenoids, alkaloids, saponins, phenols, vitamins, and tannins [4]. Among these compounds, saponin is particularly significant and is primarily found in the plant's roots. As a result, these precious roots are being exploited for industrial purposes, necessitating the extraction of the entire plant from its natural habitat, and Chlorophytum borivilianum is therefore classified as an endangered herb [5]. The Medicinal Plant Board of India promotes and protects this plant, which is ranked 26th among the highest-priority medicinal plants due to its exceptional medical properties. The Indian government has promoted the cultivation of Chlorophytum borivilianum due to its significant economic potential. However, inadequate seed germination and tuber dormancy negatively affect the consistent availability of Musli in the market [6, 7]. Traditional methods of plant propagation are insufficient to meet the growing demand for Chlorophytum borivilianum, highlighting the need for in vitro propagation for large-scale commercial production [8]. Micropropagation is a crucial technique used to propagate important species commercially and conserve germplasm. The method of micropropagation is employed to generate plants of superior quality that are disease-free and retain their authentic traits [9, 10]. To assess the effectiveness of this procedure, it is crucial to meticulously observe and measure the growth characteristics of the plant. This requires careful control over multiple factors, including the choice of explant, media composition, sterilization methods, and culture conditions. Media composition plays a vital role in successful micropropagation, as the concentrations of hormones, macronutrients, micronutrients, and vitamins have a significant impact [11].
While numerous studies have examined the effects of manipulating hormone concentrations, relatively little attention has been given to investigating differences in macronutrient compositions [12]. Each plant requires unique and specialized combinations of macronutrients. Numerous synthetic media have been developed to provide plants with the essential nutrients and additives necessary for optimal growth. Each type of media has its own distinct composition of macronutrients [13]. The development of plant cells or tissues is dependent on six primary elements: nitrogen (N), phosphorus (P), potassium (K), calcium (Ca), magnesium (Mg), and sulphur (S). Macronutrients are essential nutrients that provide the components necessary for plant growth and development. Each species has different ideal nutrient concentrations required to achieve the highest development rates [14]. The formulation of media for plant tissue culture is crucial. Murashige and Skoog have been recognized as effective basal media, which have been widely used to culture various plant species without any noticeable physiological issues.
Nevertheless, it is worth noting that mineral requirements can vary among plant genotypes and tissue culture techniques. Some researchers have even suggested that the composition of the MS formulation may be supraoptimal. Alterations to macronutrient concentrations have been explored through preferential MS modifications [15].
The data collected from plant tissue culture studies include various variable types, such as continuous, count, binomial, or multinomial. To ensure accuracy, researchers typically employ statistical methods such as Analysis of Variance (ANOVA) and linear regression [16]. If the continuous data follow a normal distribution, ANOVA is appropriate; however, it is improper to use ANOVA to analyze count, binomial, or multinomial data without prior adjustment. Traditional statistical methods can also fail when dealing with complex and nonlinear inputs [17, 18].
Machine Learning (ML) and ANN models are cutting-edge technologies that can assess and enhance the output variables based on the input parameters [19]. Using advanced technologies such as ML algorithms, GPR, and MLP neural networks, the shoot count and length are predicted from various combinations of macronutrients in the culture media.
In this paper, the growth indices against each media formulation are noted. Machine Learning and Artificial Neural Network (ANN) models are utilized to assess and enhance the output variables based on the input parameters. The paper is structured as follows: Section 2 describes the modelling techniques used and their methodology. Section 3 details the experimental setup for in vitro propagation, presented using a flowchart design, followed by a performance evaluation of both models. The results are analyzed and discussed in Section 4 based on R-squared (R2), Root Mean Square Error (RMSE), Mean Square Error (MSE), and accuracy percentage. Section 5 concludes the paper.
2. METHODOLOGY
For this study, we investigated the efficacy of two distinct modelling procedures, ANN-MLP and Machine Learning Model-Gaussian Process Regression, in representing the data.
2.1. Artificial Neural Network
One of the most famous network algorithms is the feed-forward ANN, which uses a nonlinear activation function in addition to the input nodes and multiple perceptrons. The input layer, the hidden layer (or layers), and the output layer are the three interconnected parts of the structure. The dataset's inputs form the basis of the input layer, and the class number of outputs is represented by one or more neurons in the output layer. Supervised learning tasks frequently employ an MLP. To decrease the error, the weights and biases are adjusted using the backpropagation approach [20, 21]
The concepts of data processing in the brain served as the inspiration for ANNs, which are seen as an analytical way to mimic system performance. To accurately forecast the system's performance, experimental data is used to “train” the ANN [22]. Before training an ANN, the data must be normalized over the interval [0, 1]. Since ANN models rely on the neurons' transfer functions, this is essential. Without it, the sigmoid function calculations have a finite range of possible values. An ANN will fail to converge on the training data or produce useful results if the data used with it is not scaled to a suitable range. Data standardization was applied before ANN modelling to normalise and identify outliers for each cultivar.
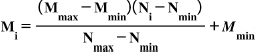
The datasets were standardized to a range of 0 to 1. The next step was to employ Principal Component Analysis (PCA) to look for data outliers; unfortunately, none were found [23, 24]. The ANN was developed based on five inputs, five macronutrient combinations at different concentrations, and two outputs: shoot length and the number of shoots. An MLP model was implemented with a hyperbolic tangent sigmoid transfer function in the hidden layer and a linear transfer function in the output layer. The model is designed with two hidden layers: the first layer has 30 neurons, and the second has 10, with an iteration limit of 1000. The network was trained using the Levenberg–Marquardt backpropagation algorithm. All data were normalized between −1 and 1 using Eq. (1) to achieve dimensional consistency of the parameters and to ensure compatibility with the adopted transfer function. Here, MiM_iMi is the normalized value, MmaxM_\text{max}Mmax and MminM_\text{min}Mmin are the maximum and minimum values of the scaling range, and NiN_iNi is the actual data to be normalized, with NmaxN_\text{max}Nmax and NminN_\text{min}Nmin representing the maximum and minimum values of the actual data [25, 26]. Subsequently, the developed model was converted into a mathematical equation through the weights and biases in conjunction with the transfer functions.
 |
(1) |
2.2. Gaussian Process Regression
One powerful nonparametric supervised learning technique that can handle both regression and classification problems effectively is the Gaussian Process (GP), also known as the Kriging model [27]. Its primary application is Bayesian nonlinear regression. It is an effective ML method that relies on the Gaussian probability density function. With a small dataset, GPR operates efficiently, consistently, and with higher accuracy than other methods [28]. A random variable's distribution is described using the Gaussian probability density function. If you have a binary dataset, you can use the GP classifier to find out what class an input sample is most likely to be in [29]. The technique consistently produces high-precision results when using small datasets [30]. It is also computationally simple. The function used to find the relationship between two variables, x and y, is shown in Eq. (2).
 |
(2) |
Gaussian Processes (GPs) are regression models that do not rely on any preconceived notions about the functional form of the data. Instead, they create a probability distribution over functions, enabling them to provide confidence estimates for predictions. This feature is highly regarded and widely used for acquisition activities. Starting with an initial probability distribution over functions, the process updates the distribution based on collected data. Gaussian Processes (GPs) are based on the idea that subsets of the function's values follow a joint Gaussian distribution [31].
It can be inferred that when a particular set of inputs is given, the resulting outputs will conform to a multivariate Gaussian distribution. The covariance of the joint distribution is determined using a kernel function, which serves as a metric for measuring the similarity between the inputs. Specifically, an Automatic Relevance Determination (ARD) kernel is employed in the GPR model. When provided with observations, such as training data, we can utilize these observations to revise the initial information and compute the subsequent distribution. When estimating the value of an input using an unknown function, we use a technique called marginalization of the posterior distribution. This allows us to obtain the average value of the input. The level of confidence in the prediction is determined by the variance [32, 33].
Bayesian optimization is integrated with the GPR algorithm to fine-tune the hyperparameters. In covariance functions, the unknown parameters are called “hyperparameters.” The GPR model is finalized once the form of the kernel function and the “hyperparameters” are established [34].
The early stopping technique sets a threshold on the gradient of the loss function (or the step size) and a validation patience value of 6 to avoid overfitting. This is achieved by observing the validation metric and halting training when no further progress is detected [35].
3. EXPLANT SELECTION AND THE EXPERIMENTAL SETUP OF IN VITRO PROPAGATION
The impact of macronutrient quantity in the media as an input variable was investigated in this work using two modelling techniques: ANN-MLP and GPR. To cover a range of inputs from 0 to 2, 60 samples were generated.
| Factor | Name | Standard MS Media Concentration (mg/L) |
Variations(mg/L) | ||
|---|---|---|---|---|---|
| - | Macronutrients | X | 0.58X | 1.42X | 2X |
| A(x1) | Ammonium nitrate | 1650 | 957 | 2343 | 3300 |
| B(x2) | Potassium nitrate | 1900 | 1102 | 2698 | 3800 |
| C(x3) | Calcium chloride anhydrous | 440 | 255 | 624.8 | 880 |
| D(x4) | Magnesium sulphate | 370 | 214.6 | 525.4 | 740 |
| E(x5) | Potassium phosphate monobasic | 170 | 99.6 | 241.4 | 340 |
Data collection from in vitro experiments is the initial step toward streamlining the training process of ANN models. A linear combination of the input and output data was used to train the model. The inputs were carefully selected to accurately represent the experimental setting's nutritional components. The shoot organogenesis data, which provided a realistic representation of the growth and development of the plant specimens under study, were used to generate the model outputs.
The primary and essential stage in the entire procedure is the selection of the crucial variables and their corresponding ranges. In this study, we employed several macronutrient permutations to generate 42 iterations of Murashige and Skoog (MS) medium. Murashige and Skoog designed the original MS medium in 1962. To stimulate micro-shoot formation, the medium was enriched with 2.5 mg/L of BAP (6-benzylaminopurine), 30 g/L of sucrose, and 8 g/lLof agar.
The concentrations of minerals and vitamins were consistent across all the various culture media designs. The standard MS media concentration was labeled “X,” while other formulations varied from it, i.e., 0.58X, 1X, 1.42X, and 2X, as depicted in Table 1. The concentration of macronutrients is expressed in milligrams. The media preparations were carefully transferred into magenta boxes after being adjusted to a pH of 5.7.
Nodal explants of Chlorophytum borivilianum were used as plant material. The Chlorophytum borivilianum plantlets were procured from Patanjali Herbal Garden, Haridwar, an institute known to protect the rare and valuable plant collections. To ensure explant cleanliness, Tween-20, a widely used surfactant, was used. Following this, the shoot bud explants were submerged in running tap water for 30 minutes to effectively remove any dust particles. The explants were sterilized with 0.1% HgCl2 for 6-7 minutes, followed by three rounds of washing with distilled water. A total of twenty explants were used for each variation, with five magenta boxes used for inoculation. Each setup was reproduced three times.
An MLP model was implemented with a hyperbolic tangent sigmoid transfer function in the hidden layer and a linear transfer function in the output layer. The network was trained with the Levenberg–Marquardt backpropagation algorithm. Forty-two treatments, including the control, were applied, divided randomly into three datasets, with 70% (30 samples) for training, 15% (6 samples) for validation, and 15% (6 samples) for testing. Additionally, GPR was calibrated and predicted using the Statistics and ML Toolbox in the MATLAB R2021a software.
All data were normalized to the range −1 to 1 using Eq. (1) to achieve dimensional consistency of the parameters and ensure compatibility with the adopted transfer function. The experiment required the cultures to be maintained in a controlled environment at 25 ± 2°C. Additionally, a photoperiod consisting of 16 hours of light and 8 hours of darkness was used. The explants were inoculated on various prepared media formulations.
3.1. Performance Evaluation for both Models
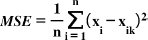
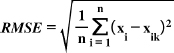
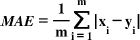
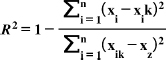
GPR was calibrated and predicted using the Statistics and ML Toolbox in the MATLAB R2021a software. The study uses Mean Squared Error (MSE), Root Mean Square Error (RMSE), Mean Absolute Error (MAE), and R-squared metrics to assess the overall performance of the models, as presented in Eqs. (3, 4, 5, and 6) [36-38]. Mean Squared Error (MSE) is the average of the squared differences between observed values in a statistical study and the values predicted by a model (Eq. 3), while errors between paired observations reflecting the same phenomenon are measured using the Mean Absolute Error (MAE), calculated using Eq. (5) [39]. The accuracy of a model's predictions improves when these metrics have lower values, indicating a closer match to the observed actual values [40]. The coefficient of determination, also known as R-squared (R2), was first introduced by Wright in 1921. It quantifies the proportion of the dependent variable's variation that the independent variables can explain. The coefficient of determination typically ranges from 0 to 1, with a perfect R2 value of 1 indicating that the regression predictions align flawlessly with the observed data (Eq. 6) [41].
 |
(3) |
 |
(4) |
 |
(5) |
 |
(6) |
| Row | GPR (No. of Shoots) | GPR (Shoot Length) | ANN (No. of Shoots) | ANN (Shoot Length) |
|---|---|---|---|---|
| Accuracyinpercentage | 99.98181865 | 99.9856376 | 99.82570316 | 97.58222034 |
| RMSE | 0.000181814 | 0.000143624 | 0.001742968 | 0.024177797 |
| MSE | 3.30561E-08 | 2.06279E-08 | 3.03794E-06 | 0.000584566 |
| R-squared | 1 | 1 | 0.999999927 | 0.999999887 |
| MAE | 9.50847E-05 | 6.53584E-05 | 0.000730307 | 0.000649414 |
4. RESULTS AND DISCUSSION
4.1. Effects of Varying Concentrations of Macronutrients on the In Vitro Growth of Plants
The Chlorophytum borivilianum explants were inoculated on MS media preparations containing 42 different concentrations of macronutrients. The explants were re-cultured after 20 days. After 20 days, the results were recorded for the number and length of the shoots at each concentration. The data was carefully recorded and utilized to train the algorithms, assessing their effectiveness in accurately predicting the desired outcomes. The highest number of shoots, 20, and shoot length, 11 cm, were observed when the concentration of ammonium nitrate, potassium nitrate, and potassium dihydrogen phosphate was 0.58 times the standard concentration (X) of the chemical compound in MS media. Additionally, the concentration of calcium chloride and magnesium sulphate heptahydrate was 1.42 times X. The most unfavourable outcomes were observed when the media contained ammonium nitrate, potassium nitrate, and calcium chloride at a concentration 1.42 times the standard, and magnesium sulphate heptahydrate and potassium dihydrogen phosphate at a concentration 0.58 times the standard.
4.2. Evaluation and Comparison of ANN and GPR Model
Our study involved the assessment and comparison of the performance of two models, namely the ANN and GPR models. Multiple performance metrics are typically taken into account when evaluating ML modelling, as relying on a single metric may not accurately predict or validate the results. Therefore, we used assessment metrics such as RMSE, MSE, R2, and MAE to predict the number of shoots and shoot length in Chlorophytum borivilianum tissue culture. Strong R2 values indicate a strong correlation between the input and output variables. These values are achieved when the difference between the average of the measured values and the predicted values is greater than the difference between the actual and predicted values. MSE is a robust performance measure that quantifies the discrepancy between actual and predicted values. High MSE values indicate high degrees of error, and conversely. The MSE values for all output variables were consistently low across all evaluated models, suggesting a minimal discrepancy between the actual and projected values [37, 41].
The GPR model demonstrated strong predictive ability for both shoot count and shoot length, as evidenced by R2 values of 1 for both models. Conversely, the ANN model yielded an R2 value of 0.999, indicating that nearly 100% of the variability in shoot organogenesis —specifically, the number of shoots and shoot length —can be accounted for by the input variables. In Gaussian Process Regression (GPR), an R-squared value of 1 indicates a perfect fit, meaning the model accounts for the variation in the dependent variable using the independent variables. This means the model's predictions match the actual observed data precisely, with no errors. GPR, a highly adaptable nonparametric model, often shows high fit when the training dataset is small, has low noise, or is assessed on the same data it was trained on. This is because, like other nonparametric models, GPR can easily overfit, particularly when working with limited data or when the training and testing datasets are identical [34, 35]. The low RMSE values of 0.00018 and 0.00014 in Table 2 suggest that there is a modest average difference between the anticipated and actual number of shoots and shoot length, respectively.
In contrast, the ANN model yielded an RMSE value of 0.0017 for the number of shoots and 0.0241 for shoot length. The MSE and MAE for both the number of shoots and shoot length are presented in Table 2, using values predicted by the ANN and GPR models. The GPR model has an accuracy % of 99.981% for the number of shoots and 99.985% for shoot length, while the ANN model has an accuracy of 99.825% for the number of shoots and 97.582% for shoot length, as mentioned in Table 2.
The performance of the built models can be analyzed by comparing the observed and predicted values of outputs derived from the processed inputs. A comparison between observed and predicted outputs elucidates the behaviour of the ANN model while analysing inputs as depicted in Fig. (1): Parts a) and b) represent the comparison of results predicted by GPR and actual results, whereas parts c) and d) represent the comparison of actual and predicted responses by ANN. The graph compares the Actual response (solid line) and the predicted response (dashed line) derived from the neural network and GPR models. The results indicated strong concordances between the measured and predicted values of explant growth parameters for both the training and testing sets (Table 2). The model demonstrates superior performance when the predicted line closely matches the actual line.
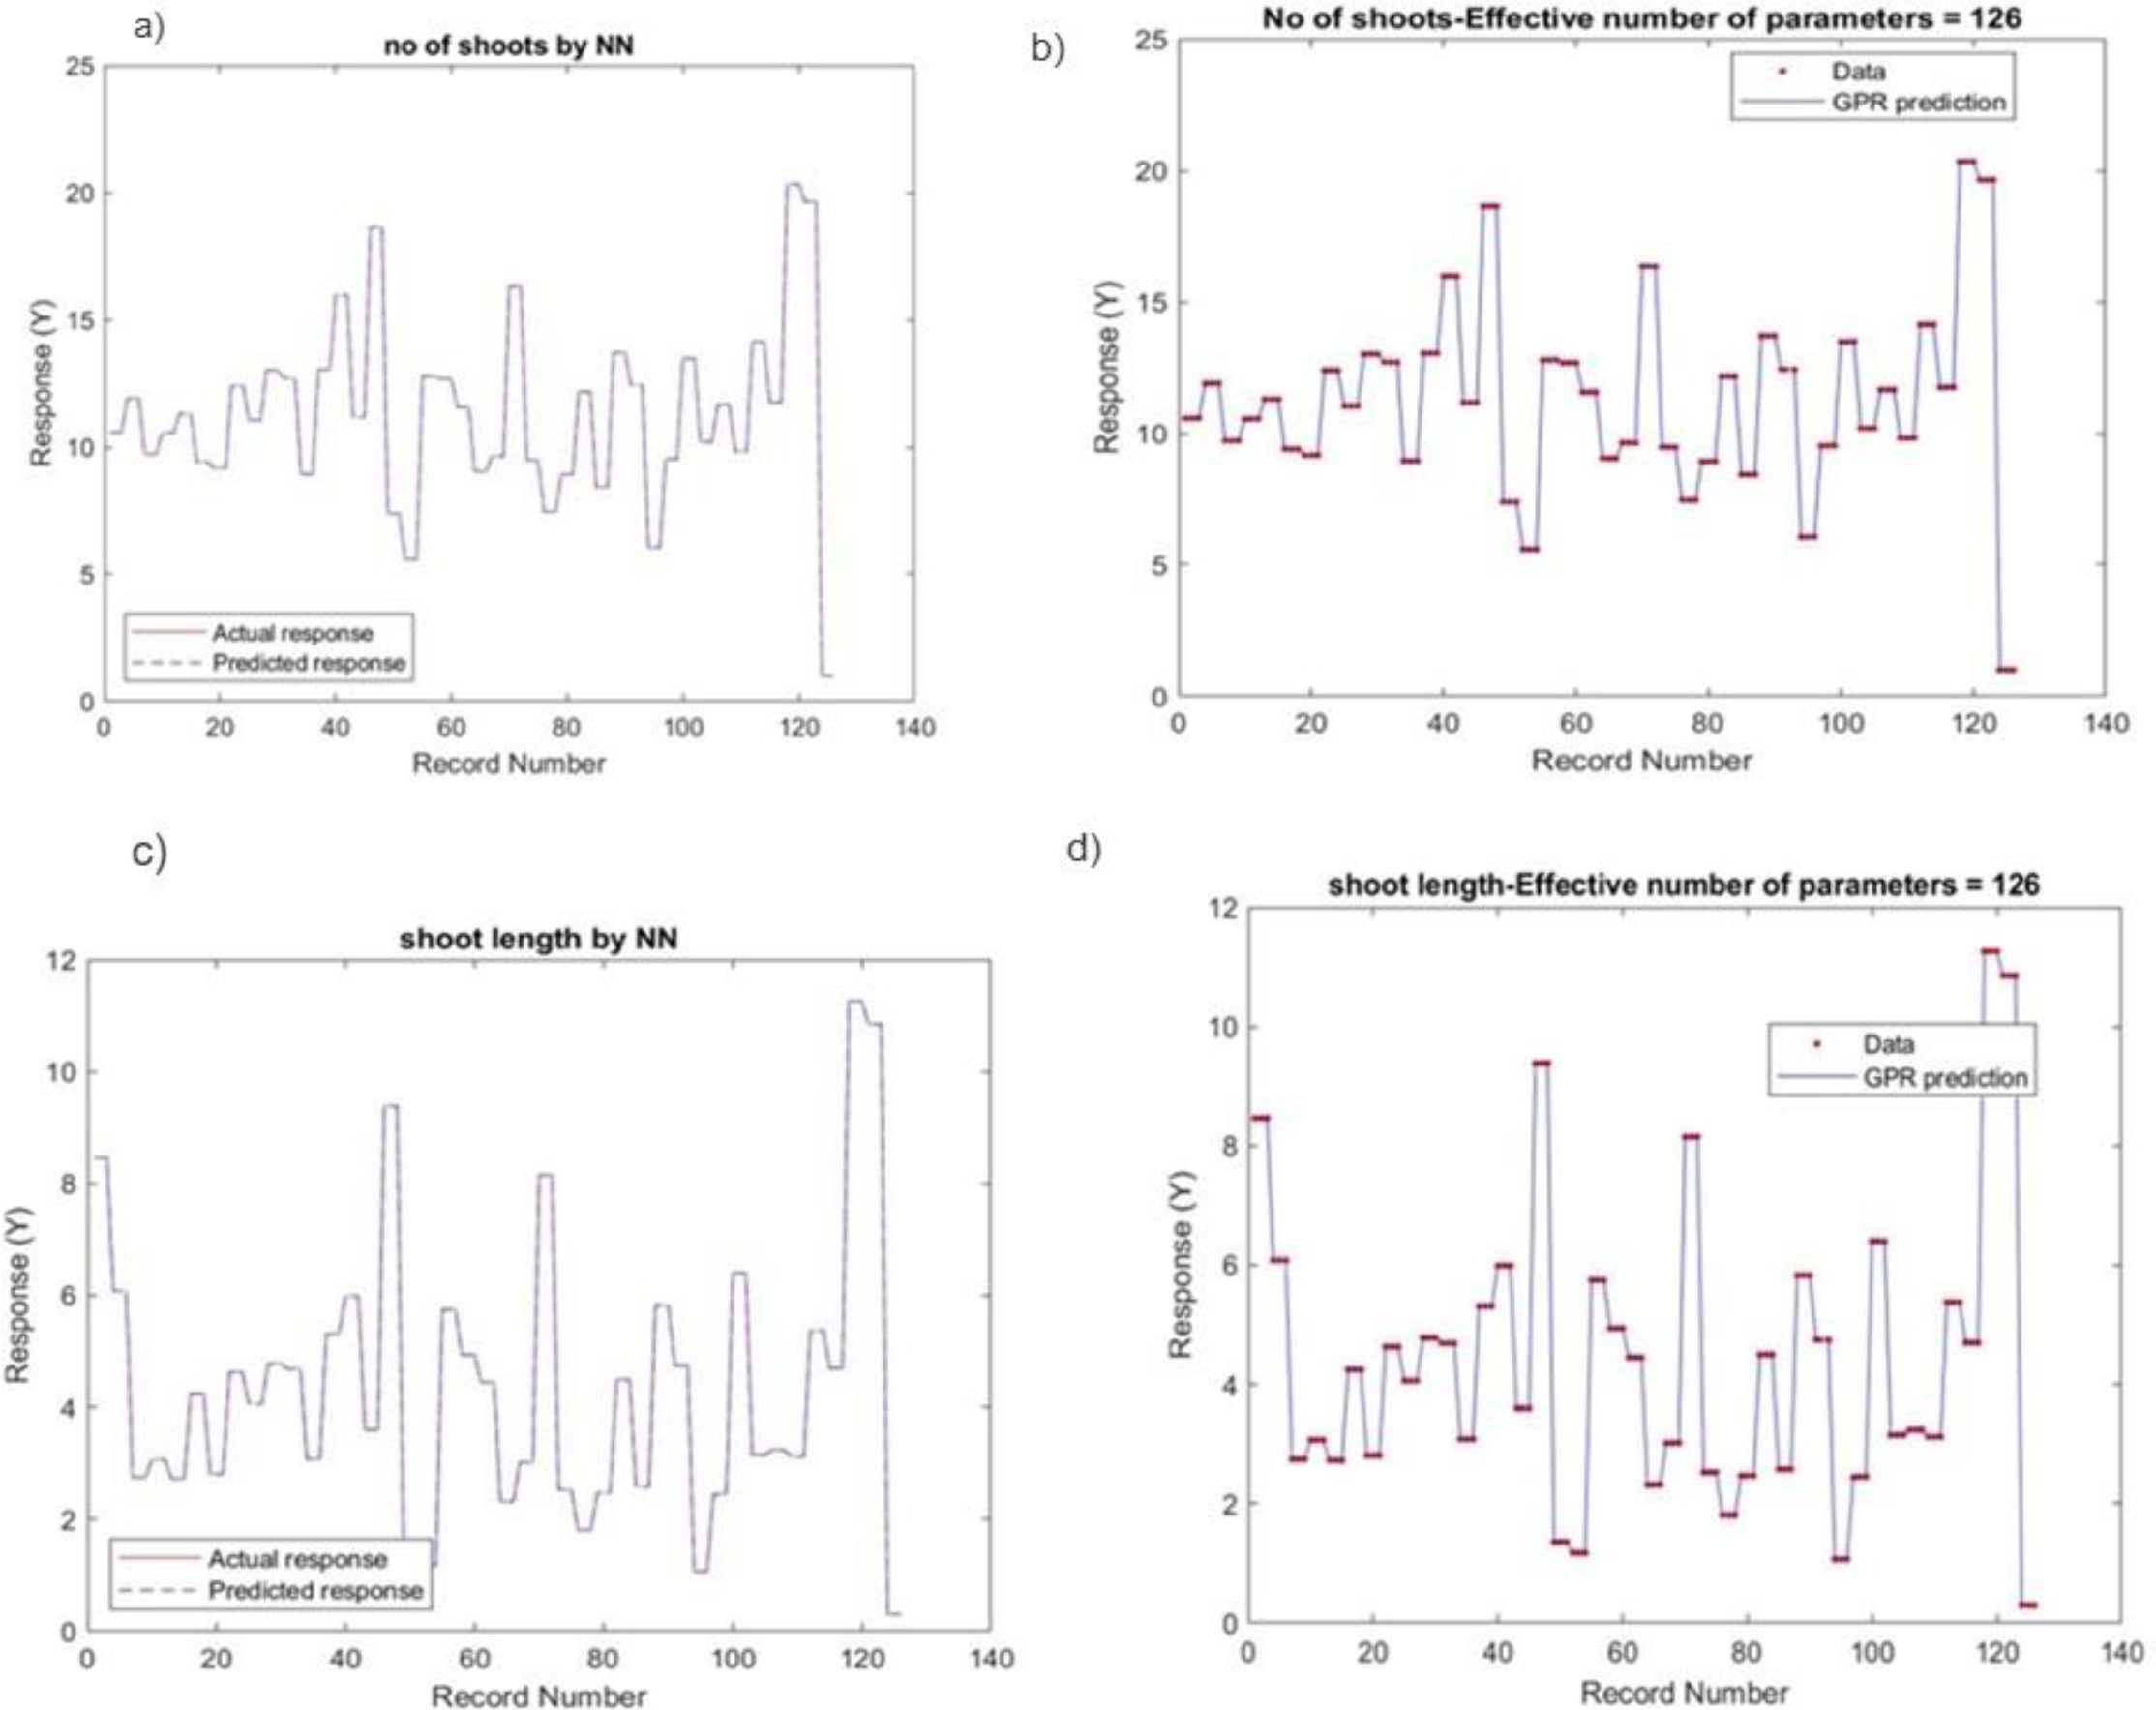
Visual representation of actual and predicted “no. of shoots” and “shoot length” response using two modelling techniques: Part (a) and (b) represent GPR model prediction, (c) and (d) represent ANN model prediction.
The statistics computed for the ANN models demonstrate a high level of concordance with the ability of the two subsets to predict each output. An inherent feature of the ANN model is its independence from a predetermined definition of an appropriate fitting function, enabling it to provide a universal approximation capability for nearly all types of nonlinear functions. This flexibility may allow the modeller to construct a model with near-optimal prediction accuracy [40].
4.3. Impact of the Concentration of Macronutrients on the Shoot Organogenesis
For proper explant development, it is necessary to use optimal nutritional media. The provision of nitrogen in the culture media as nitrate or ammonium is a fundamental requirement for the growth of explants [42]. Type and quantity of nitrogen provided may be affected by genotype. Undoubtedly, nitrate is the preferred type of nitrogen for most plant species. However, recent research from the Central Institute of Aromatic and Medicinal Plants (CIMAP) has shown that the crop has minimal requirements for nitrogen, phosphate, and potassium [43]. In our study, we also found that shoot growth is favourable when the amounts of ammonium nitrate, potassium nitrate, and dihydrogen phosphate are reduced from the original MS media composition, especially when the higher concentrations of ammonium nitrate and potassium nitrate are reduced.
In contrast, higher concentrations of calcium chloride and magnesium sulphate, which are almost double those found in MS media, favoured shoot organogenesis in the plant. The necessary reagents in the MS medium have been identified as calcium chloride (CaCl2), magnesium sulphate (MgSO4), and potassium sulphate (KH2PO4) [44, 45].
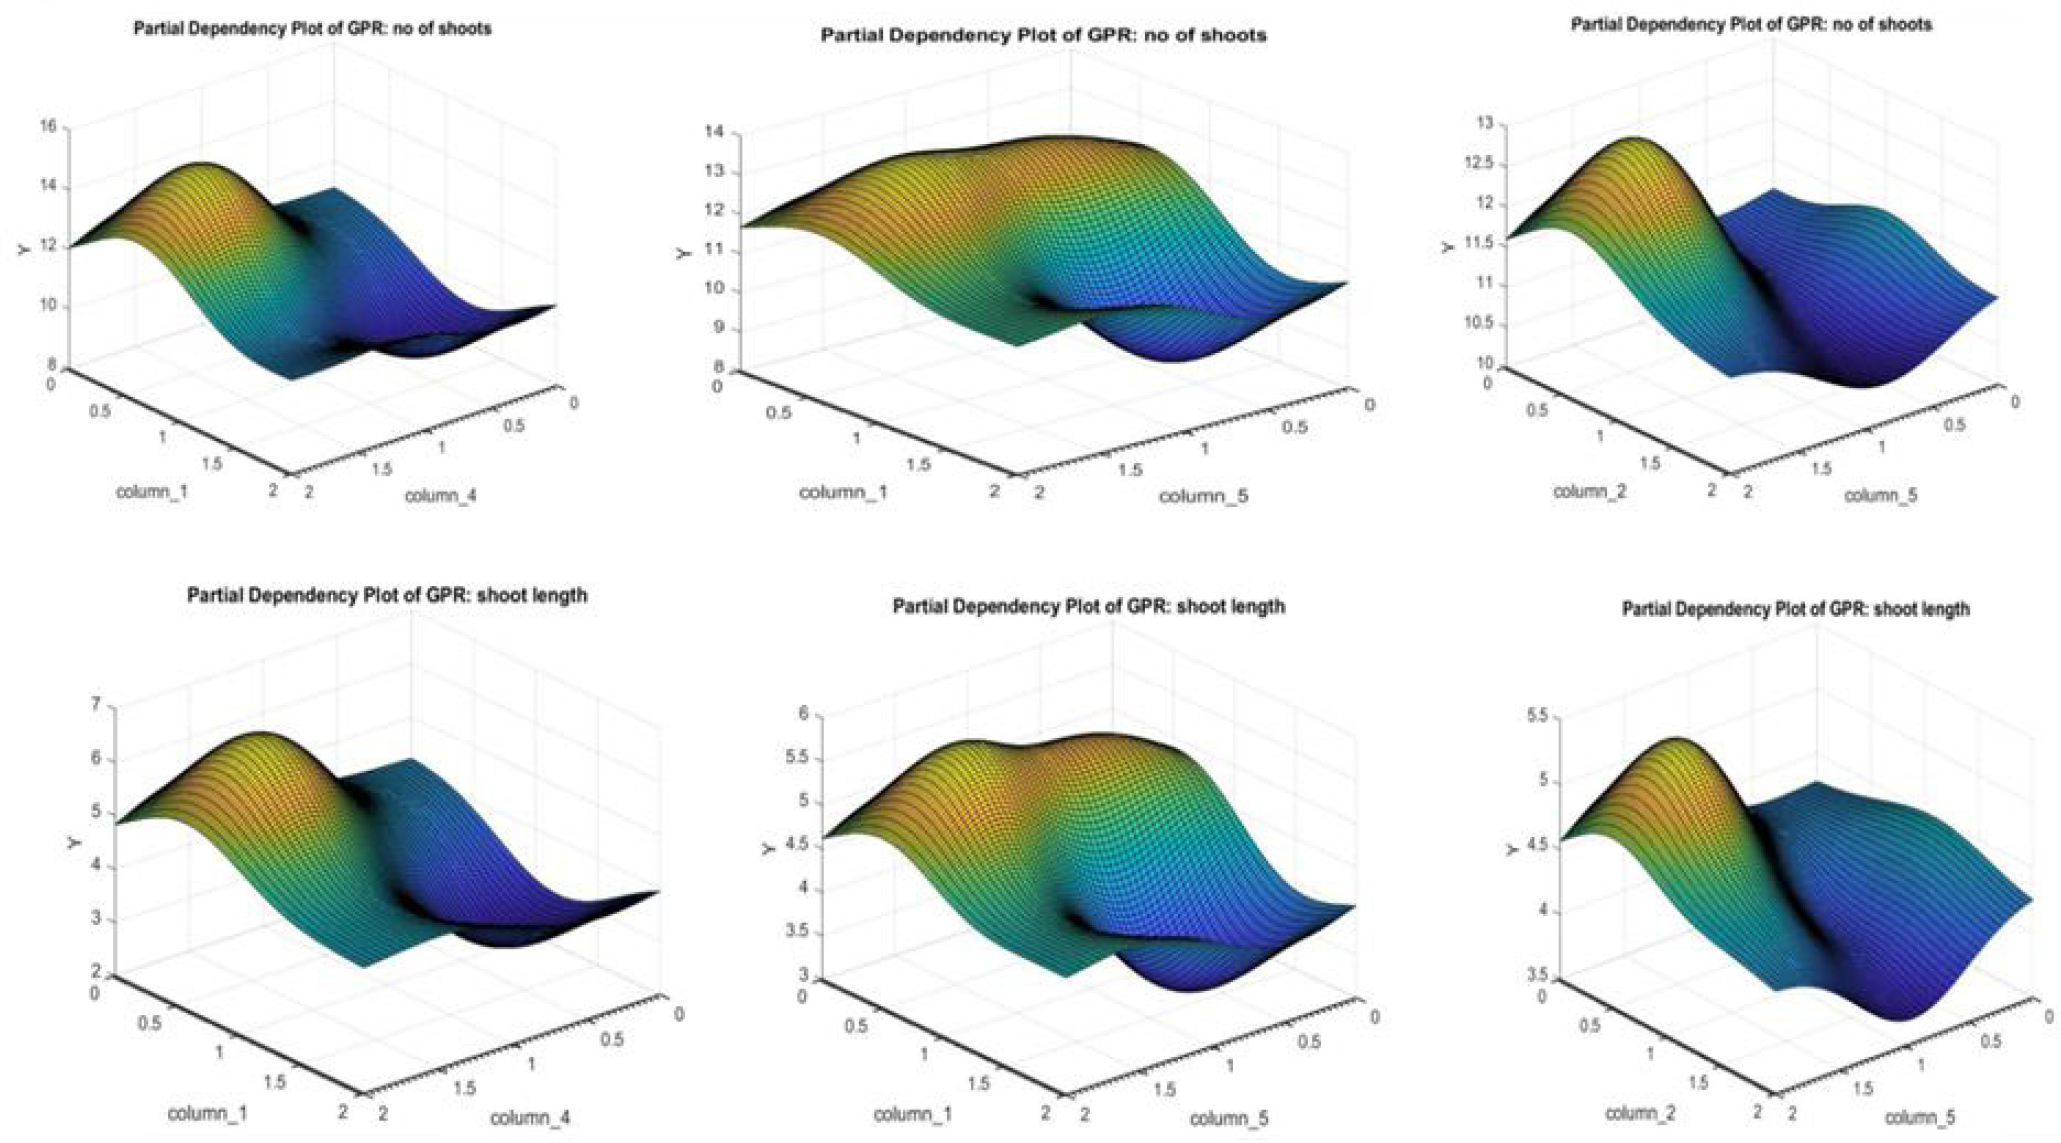
Partial dependency plot given by the GPR model depicting the effect of different macronutrient compositions on the number of shoots and shoot length.
Calcium and magnesium play vital roles in plant tissue culture, contributing to cell division, growth, and overall plant health. Calcium is essential for cell wall formation and cell elongation, while magnesium is a key component of chlorophyll, aiding in photosynthesis. Both minerals also act as enzyme activators and influence nutrient uptake and stress tolerance [46-49]. Nikam and Chavan [50] explored the nutrient absorption pattern of C. borivilianum throughout its various growth phases. They found that nitrogen and potassium levels increased in the leaf tissue up to 75 days of growth, after which they decreased. Conversely, calcium and magnesium continued to accumulate in both leaf and tuber tissues throughout the plant's development.
The Partial dependency plots for the GPR and ANN models are shown in Figs. (2 and 3), respectively.
The concentration of macronutrients determines the structural and physiological changes that result from their interactions with plants. It is mainly the dosage at which macronutrients are given that determines their efficiency. As the ideal concentrations of macronutrients vary from plant to plant, both suboptimal and supraoptimal levels can have both beneficial and harmful effects on plant growth and development.
Multiple studies have assessed the effectiveness of GPR and ANN in modelling various processes. The performance of both models was evaluated by comparing their ability to predict both observed and unknown variables.
Analyzing the MSE statistics, GPR demonstrated superior performance compared to ANN. Comparing GPR and ANN models for predicting shoot organogenesis in the micropropagation of Chlorophytum borivilianum, researchers found that the GPR model outperformed the ANN model in predicting shoot number and shoot length. The weightage preference for each input regarding shoot organogenesis predicted by the GPR model is illustrated in Fig. (4): Part a) represents the Number of shoots, while part b) represents shoot length. Each bar indicates the “Predictor Weight,” which quantifies the influence or importance of each predictor variable (x1-x5) on the respective outcome. A higher bar signifies a greater impact.
Number of Shoots: In the left chart, predictor x3 and x4 are shown to have the most significant weight, indicating they play the largest role in predicting the “Number of Shoots.” Predictors x1 and x5 also have notable weights, whereas x2 is less influential. Shoot Length: In the correct chart, predictors x3 and x4 again have the highest weight, underscoring their substantial impact on “Shoot Length.” Predictors x1 and x5 maintain considerable weights, similar to their influence on the “Number of Shoots,” while x2 remains the least significant. These charts consistently highlight predictor x3 and x4 as the key factors affecting both the “Number of Shoots” and “Shoot Length,” with x2 being the least impactful. This analysis is crucial for identifying the most significant input features in predicting specific outcomes within the model.
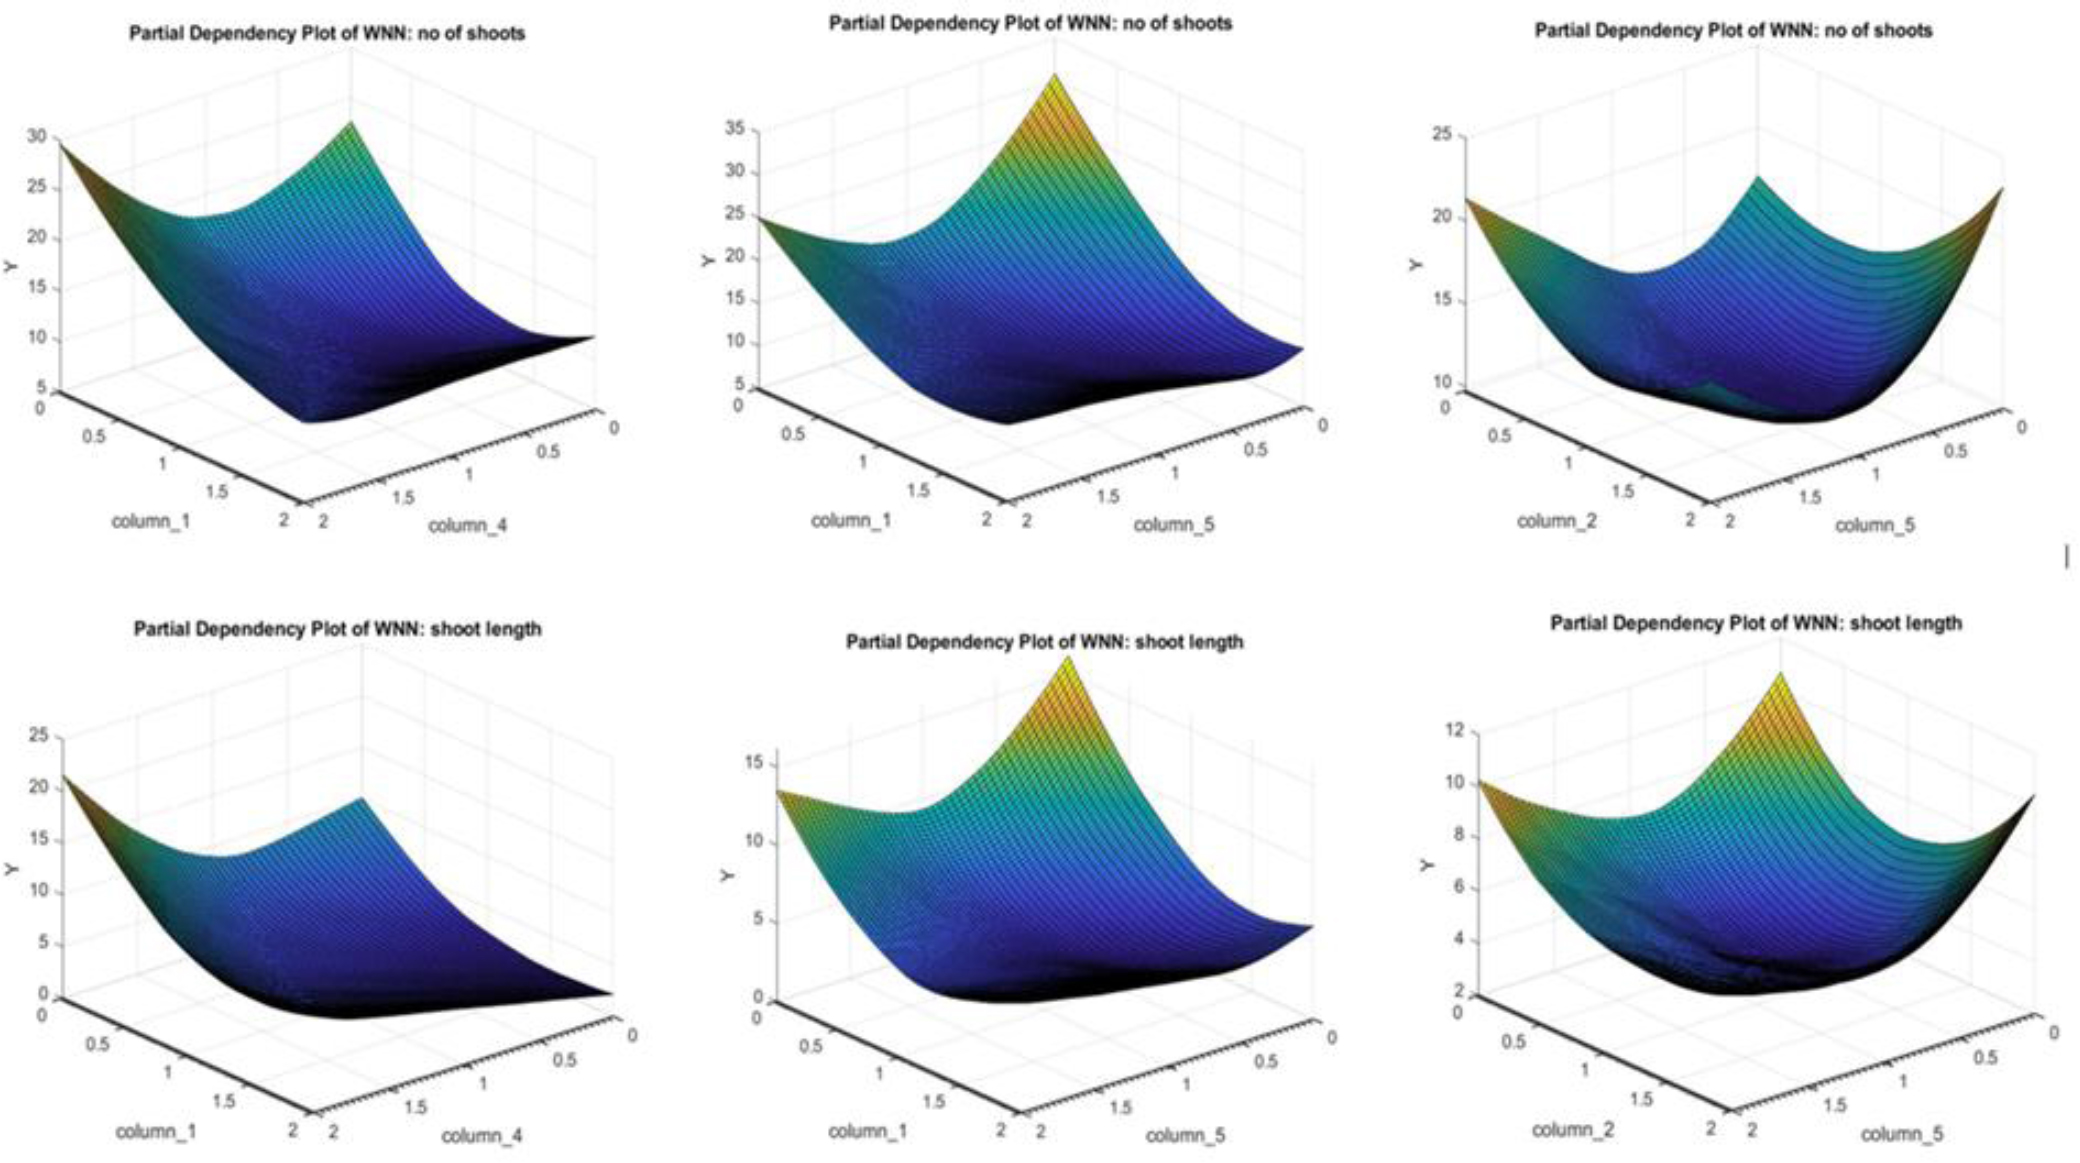
Partial dependency plot given by ANN model depicting the effect of different macronutrient compositions on number of shoots and shoot length.
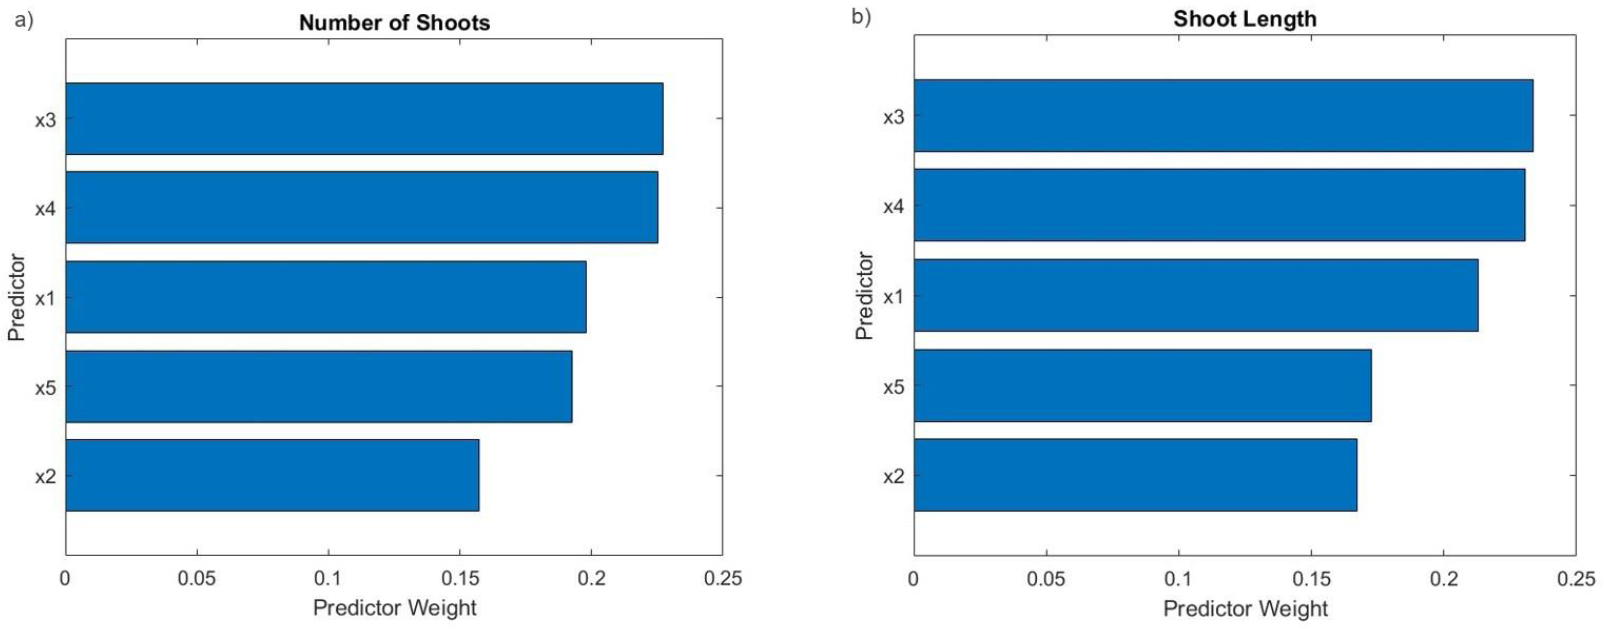
The prioritization of each input (macronutrient concentrations) for predicting: Part (a) the number of shoots and Part (b) the shoot length.
5. LIMITATIONS
While minimizing the training cost function, neural network models can occasionally result in overfitting. Additionally, they require prior process data. Both the quality and quantity of the training data significantly influence the accuracy of network predictions. Although ANN and GPR are both heuristic methods, they exhibit notable conceptual differences. The GPR algorithm requires less data than ANN and is more user-friendly. The risk of overfitting in GPR is lower than in ANN. Therefore, when working with smaller datasets, GPR often outperforms ANN in terms of prediction accuracy. However, the model's success is strongly influenced by the choice of kernel function and the tuning of its hyperparameters. Nevertheless, the GPR method is not recommended for extensive training datasets, as an increase in dataset size rapidly raises the computational cost of employing GPR.
Conversely, MLP models require extensive, high-quality datasets for effective training. In the realm of plant tissue culture, creating these comprehensive datasets can be both time-intensive and costly. This challenge is compounded by plants' varying responses to different media components and environmental conditions. Additionally, ML models may struggle to be applicable across various plant species or even within different genotypes within the same species.
CONCLUSION
To address the challenges associated with tissue culture, several models are available. We evaluated the performance of GPR and ANN-MLP models and found that the results of the laboratory experiments align closely with the predictions obtained from the MLP model. The findings of this study validate the efficacy of both the GPR and MLP models in accurately forecasting tissue culture stages. Furthermore, the remarkable consistency between the predicted and observed training and testing values indicates that these models are highly proficient in analyzing the variables investigated in the study. For this research, GPR and ANN models were employed to predict the number of shoots and shoot length in Chlorophytum borivilianum. The GPR model outperformed the ANN-MLP model, albeit by a narrow margin. Both models can be efficiently utilized to identify treatment interactions in various experiments, reducing the need for traditional statistical analysis. Overall, the findings suggest that the GPR model is a suitable choice for predicting the ideal macronutrient composition to maximize the number of shoots and shoot length in Chlorophytum borivilianumin vitro tissue culture.
AUTHORS’ CONTRIBUTIONS
The authors confirm contribution to the paper as follows: P.K.: Execution, methodology, data curation, and writing the original draft; N.K.: Handled software, formal analysis, and validation; P.A.: Contributed to data curation and software; S.K.: was involved in conceptualization, resources, project administration, and supervision. All authors have read and agreed to the published version of the manuscript.
LIST OF ABBREVIATIONS
| ANN | = Artificial Neural Network |
| ANOVA | = Analysis of Variance |
| GPR | = Gaussian Process Regression |
| MS | = Media Murashige & Skoog media |
| MLP | = Multi Layer Perceptron |
| MSE | = Mean Squared Error |
| RMSE | = Root Mean Square Error |
AVAILABILITY OF DATA AND MATERIALS
The data and supportive information are available within the article.
ACKNOWLEDGEMENTS
Declared none.