All published articles of this journal are available on ScienceDirect.

Glycerol Bioconversion into Bioethanol: A Comparative Analysis of Microbial Growth and Structural Adaptation
Authors Info & Affiliations
Abstract
Introduction
Glycerol, the main byproduct of biodiesel production, poses environmental challenges if not effectively utilized. Converting glycerol into bioethanol provides a sustainable route to support renewable energy development. This study explores the potential of microbial isolates with high lipase activity for efficient glycerol fermentation.
Methods
The tested strains included three bacteria (Serratia sp., Pseudomonas sp., Escherichia coli), one yeast (Saccharomyces sp.), and two fungi (Aspergillus sp., Trichoderma sp.). Morphological adaptations were evaluated using Scanning Electron Microscopy (SEM), and ethanol production was validated through Fourier-Transform Infrared (FT-IR) spectroscopy by identifying characteristic absorption peaks. Quantitative analysis of ethanol yield and glycerol conversion was conducted using High-Performance Liquid Chromatography (HPLC).
Results
SEM analysis confirmed structural adaptation of Serratia sp. and Saccharomyces sp. under fermentation stress. FT-IR analysis verified the presence of ethanol with an absorption peak at 3251.52 cm−1. HPLC results showed that Serratia sp. produced the highest ethanol yield of 17.83% (5.35 g/L) with a glycerol conversion of 40.33%, followed by Trichoderma sp. with a yield of 17.37% (5.21 g/L) and a conversion of 39.56%. Although E. coli exhibited the highest glycerol conversion (80.54%), its ethanol yield was low (1.88%), indicating diversion toward other metabolic pathways.
Discussion
These results highlight the superior adaptability and metabolic efficiency of Serratia sp. in channeling glycerol toward ethanol production. Structural stability under osmotic and ethanol stress supports its role as a robust bioethanol producer, while differences among species underscore the importance of strain-specific optimization.
Conclusion
Serratia sp. demonstrates strong potential for glycerol-to-bioethanol conversion, providing a promising candidate for sustainable biofuel production and biodiesel waste valorization.
1. INTRODUCTION
Bioethanol production from biodiesel waste glycerol is a significant alternative to providing renewable energy [1, 2]. In this context, glycerol is the main byproduct of biodiesel production and accounts for about 10% of the total output. Therefore, the surplus glycerol generated has become an economic and environmental challenge with the global increase in biodiesel production [3, 4]. A sustainable solution is provided by turning glycerol into bioethanol because the compound is frequently impure and has no economic value [5, 6]. This procedure reduces the environmental effect of producing biodiesel while converting waste streams into valuable fuel [7, 8]. Bioethanol is produced through biomass fermentation starting from the first generation and has been known as an environmentally friendly alternative energy to conventional fossil fuels. This renewable fuel offers several advantages, including significantly reducing Greenhouse Gas (GHG) emissions [9, 10]. According to the United States (U.S.) Department of Energy report, bioethanol reduces CO2 emissions by up to 34% compared to fossil gasoline, depending on the production methods and biomass sources used [1]. This renewable fuel contributes to climate change mitigation by reducing dependence on fossils [3]. The photosynthesis process in bioethanol-producing plants absorbs CO2 from the atmosphere to offset emissions generated when bioethanol is used [11].
Based on the explanation, bioethanol is important in the global transition to sustainable energy [12, 13] and can be directly used in vehicles without significant modification. This is an advantage in a faster transition to renewable energy use [14]. The conversion of glycerol into bioethanol creates value from waste and closes the biodiesel production cycle to improve the overall economic feasibility [7, 15]. Previous research showed that glycerol conversion efficiency could reach more than 90% under optimized fermentation conditions [16]. Reducing waste and enhancing the economic value of raw materials through bioethanol production can improve the profitability of the biodiesel industry. This situation enables producers to invest in sustainable and efficient technologies [17, 18].
The yeast cerevisiae has long been recognized as a microorganism capable of converting glycerol into ethanol through fermentation [19]. However, the effectiveness and efficiency of the process are influenced by fermentation conditions and the ability of the microorganism to adapt to the glycerol substrate. Several studies have examined the role of Saccharomyces cerevisiae and the bacterium Escherichia coli as fermentation agents in bioethanol production [20, 21]. However, exploration of the potential of other bacteria, such as Serratia and Pseudomonas aeruginosa, as well as fungi including Trichoderma and Aspergillus niger, remains limited.
This research observed the morphological adaptation of microorganisms during glycerol metabolism, using color changes and the turbidity level of the fermentation medium as initial indicators of metabolic activity [22]. Scanning Electron Microscopy (SEM) served as the principal method for high-resolution micrograph analysis, facilitating the examination of microorganism surface structures, morphological alterations, and microbial interactions within the fermentation environment [23]. The SEM method effectively identifies structural changes indicative of microbial adaptation to the glycerol substrate. A combination of visual, microscopy, spectroscopic, and chromatographic methods was used to assess the effectiveness of glycerol fermentation and the morphological differences among the involved microbial strains. Fourier-Transform Infrared (FT-IR) spectroscopy was applied to identify the ethanol spectrum produced, confirming the successful bioconversion of glycerol into bioethanol. Additionally, High-Performance Liquid Chromatography (HPLC) was used to quantitatively identify glycerol and ethanol after fermentation [24]. The results could be an alternative reference for improving bioethanol production from biodiesel byproducts.
2. METHODOLOGY
This research was designed to evaluate microbial growth and morphology during glycerol fermentation into bioethanol and to identify the ethanol produced through spectroscopic and chromatographic analysis. The stages included the preparation of materials and reagents, followed by glycerol fermentation using three bacterial (Pseudomonas sp., Serratia sp., and Escherichia coli) and fungal strains (Saccharomyces sp., Aspergillus sp., and Trichoderma sp.) [4]. Subsequently, analyses were conducted using SEM, FT-IR, and HPLC to observe morphological changes in the microorganisms, determine the ethanol spectrum produced, and conduct quantitative analysis.
2.1. Microbial Strains and Culture Preparation
A total of six microbial strains that have high lipase activity (5.01–6.26 mU/g) were selected for the potential in glycerol bioconversion, namely Serratia sp., Saccharomyces cerevisiae, Pseudomonas sp., Escherichia coli, Aspergillus sp., and Trichoderma sp. Re-culturing microbes obtained from earlier research rejuvenated bacterial and fungal isolates [4]. Bacterial colonies were purified by transferring them with an inoculation loop on Nutrient Agar plates and incubated for 24 hours. This process obtained a pure culture sample of lipolytic bacteria. The yeast isolate rejuvenation method was also adapted from previous research. Purification was performed by transferring yeast colonies with an inoculation loop onto plates containing PDA (Potato Dextrose Agar) medium, followed by incubation for 3-4 days. This method led to a pure culture sample of lipolytic yeast [25].
Microorganisms developed from previous research [4] are stored and rejuvenated in the genomic laboratory of the National Research and Innovation Agency of Indonesia. For bacterial inoculum preparation, Luria Bertani (LB) medium was used. LB medium consists of peptone (10 g/L), yeast extract (5 g/L), and sodium chloride (10 g/L), providing the necessary nutrients to support rapid and robust bacterial growth. Each bacterial isolate was pre-cultured by inoculating 10 mL into a 200 mL Erlenmeyer flask containing 100 mL sterile LB medium. Cultures were incubated at 30°C and agitated at 150 rpm for 7 days. After incubation, bacterial cultures were centrifuged at 6000 rpm for 10 minutes at room temperature to obtain the cell pellets used for fermentation [26].
This research used the Potato Dextrose Broth (PDB) medium for the growth of yeast and fungi [27]. PDB was prepared by dissolving it in distilled water, then homogenizing and sterilizing it using an autoclave at 121°C for 15 minutes to ensure the medium was free from contamination. Subsequently, the pure isolate was aseptically inoculated into a sterile PDB medium, and the incubation was conducted for 10 days at 30°C or room temperature. After the incubation, the culture was separated using Whatman No. 1 sterile filter paper (pore size 11 µm) to collect the culture broth or enzymes produced by the yeast. All microbial strains were maintained under the same respective media conditions throughout the study to ensure comparability of growth and fermentation performance.
2.2. Fermentation Setup and Conditions
The glycerol fermentation process starts by mixing 200 mL of 30% (w/w) glycerol solution with 100 mL of microbial culture prepared in a medium rich in nutrients such as nitrogen, phosphorus, and other essential minerals. This mixture was inoculated with selected microorganisms, including three bacterial strains (Pseudomonas sp., Serratia sp., and Escherichia coli) and three fungal strains (Saccharomyces sp., Aspergillus sp., and Trichoderma sp.), recognized for the ability to convert glycerol into ethanol [4]. Fermentation occurs at a temperature of 40°C and a pH of 4-5 for 3 days based on the optimal growth and activity conditions for the microorganisms. Visual observations were conducted daily for 3 days to evaluate color changes and turbidity during fermentation. After 72 hours, samples were taken and separated into supernatant and solid. The solid was analyzed using SEM, while the supernatant was examined qualitatively and quantitatively using FT-IR and HPLC, respectively. This method evaluated the potential of microbes in converting glycerol to ethanol, which helped in the bioconversion process.
2.3. High-performance Liquid Chromatography (HPLC) Analysis
The type of HPLC used was Waters Alliance, Shimadzu Shimpack GIST C18 (4.6 mm x 250 mm, 5 μm), UV/VIS detector operated at a wavelength of 210 nm [28]. Meanwhile, a mixture of 95% water and 5% acetonitrile was used as the mobile phase. The elution process was carried out isocratically, with a fixed mobile phase composition during the analysis, allowing consistent and efficient separation of analytes [29]. The injection volume used was 20 µL, sufficient to provide a good signal response to the detector without causing overload on the column. The mobile phase flow rate was set at 0.5 mL/min, and the column temperature was constant at 80°C. This temperature condition was selected to maintain the stability of analyte retention and ensure the detection of ethanol without being affected by temperature fluctuations [30]. The sample was filtered with a 0.1 μm filter paper to avoid contamination or solid particles damaging the HPLC column. Ethanol was identified by comparing the retention time of sample peaks to the required standard, with the retention time observed at approximately 11.19 minutes.
Ethanol quantification was achieved by constructing a calibration curve using standard solutions of known concentrations. The area under the peak corresponding to ethanol in the chromatogram was measured and compared to the calibration curve to determine the concentration. Meanwhile, the reproducibility of the HPLC results was verified by performing duplicate analyses for each sample. Fermentation yields and glycerol conversion were determined using Eqs. (1 and 2), respectively.
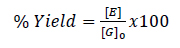
Where [G]0 is the substrate's starting concentration of glucose 30% (mg/mL), [G]f is the substrate’s final concentration of glucose, and [E] is the concentration of ethanol in the fermentation broth (mg/mL) [31].
2.4. Scanning Electron Microscopy (SEM) Analysis
The sample preparation for SEM analysis starts with centrifuging the fermentation product at 8,000 rpm and 4°C for 10 minutes to separate the pellet from the supernatant. The pellet is collected and sterilized by immersing it in a 96% glutaraldehyde solution for 24 hours to prevent microbial spread on the equipment and to ensure safety. After disinfection, the microbial pellet was separated from the glutaraldehyde solution. The samples were dried using a critical point dryer and coated with gold-palladium before observation under a JEOL JSM-6510 SEM at magnifications up to 10,000× [32].
2.5. Fourier Transform Infrared Spectroscopy (FT-IR) Analysis
Bioethanol production was confirmed by FT-IR spectroscopy (PerkinElmer Frontier), with spectral resolution set at 4 cm−1 and scanning range 4000–500 cm−1. The FTIR sample was clarified by centrifugation at 8000 rpm, followed by filtration through a 0.22 µm sterile membrane filter. Compared to standard ethanol spectra, ethanol presence was determined by the absorption peak at ~1050 cm−1 (C-O stretching) and ~3300 cm−1 (O-H stretching). Additionally, a liquid nitrogen-cooled MCT-A detector was also available with a Universal Attenuated Total Reflectance (UATR) [33].
2.6. Statistical Analysis
All experimental data were collected in duplicate and expressed as mean ± Standard Deviation (SD). One-way Analysis of Variance (ANOVA) was conducted to evaluate significant differences among microbial treatments regarding ethanol yield and glycerol conversion. When significant differences were detected, Tukey’s post-hoc test was applied to identify pairwise differences between groups, using a significance level of p < 0.05. All statistical analyses were performed using IBM SPSS Statistics software (IBM Corp., Armonk, NY, USA).
2.7. Research Diagram
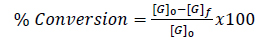
Figure 1 shows the overall process of bioethanol synthesis and characterization from glycerol. This diagram provides an overview of microbial fermentation, ethanol production, and analytical characterization using SEM and FT-IR.
3. RESULTS AND DISCUSSION
3.1. HPLC Calibration for Glycerol and Ethanol Quantification
The accuracy and precision of glycerol and ethanol quantification were validated using HPLC. Table 1 presents the linear range, regression equations, coefficients of determination (R2), and Limits of Detection (LOD) for glycerol and ethanol. The high R2 values (≥ 0.9978) show strong linear correlations between concentration and peak area, ensuring reliable quantification. The calibration for glycerol followed the equation y = 2.8332E+06x + 1.9842E+06, with an R2 value of 0.9978, indicating a strong linear correlation and high precision in detecting the concentrations within the tested range. Similarly, the ethanol calibration produced the equation y = 30,981.5x + 14,025.5, with an R2 value of 0.9983, reflecting an excellent fit for quantifying the concentrations [34]. These equations were used to calculate the residual glycerol and ethanol concentrations in the fermentation broth, enabling precise determination of conversion rates and yields for evaluating microbial efficiency.
Diagram of bioethanol synthesis and characterization from glycerol.
| Component | Concentration (g/L) | Regression Equation | R2 | LOD (mg/L) |
|---|---|---|---|---|
| Glycerol | 1-20 g/L | y = 2.8332E+06x + 1.9842E+06 | 0.9978 | 98.4 |
| Ethanol | 1-20 g/L | y = 30,981.5x + 14,025.5 | 0.9983 | 98.4 |
| Microbial Strain | Ethanol Yield (g/L) | Glycerol Conversion (%) |
|---|---|---|
| Serratia sp. | 5.35 ± 0.12 a | 40.33 |
| Trichoderma sp. | 5.21 ± 0.15 a | 39.87 |
| Saccharomyces cerevisiae | 4.89 ± 0.11b | 38.45 |
| Pseudomonas sp. | 3.76 ± 0.09 c | 29.42 |
| Aspergillus sp. | 3.45 ± 0.08 c | 27.88 |
| Escherichia coli | 2.89 ± 0.07 d | 23.75 |
3.2. Ethanol Production and Microbial Performance
The ethanol production results varied across microbial strains, with Serratia sp. and Trichoderma sp. reporting the highest yield of 17.83% (5.35 g/L) and 17.37% (5.21 g/L), as well as 40.33% and 39.56% conversion rate of glycerol, respectively. In contrast, Escherichia coli showed the lowest ethanol production due to suboptimal metabolic pathways for glycerol fermentation. According to Table 2, quantitative analysis using HPLC after 3 days of fermentation confirmed the results, with Serratia sp. reported as the most efficient candidate. Statistical analysis was conducted using one-way ANOVA, followed by Tukey's post-hoc test, to validate the reproducibility and significant differences among ethanol yields of tested strains (p < 0.05).
Based on the quantitative analysis using HPLC, Serratia sp. demonstrated the best performance in synthesizing bioethanol from glycerol compared to other microbes, including Trichoderma sp., Pseudomonas aeruginosa, Saccharomyces cerevisiae, Aspergillus sp., and Escherichia coli. Serratia sp. achieved a glycerol conversion rate of 40.33%, producing the highest ethanol concentration of 5.35 g/L and a yield of 17.83%. This high yield shows the metabolic efficiency of Serratia sp. in channeling glycerol as a substrate for ethanol production. The results are consistent with [35], reporting Serratia sp. as an effective bacterium for ethanol synthesis under stress conditions induced by substrate toxicity.
Trichoderma sp. reported an ethanol yield, concentration, and glycerol conversion rate of 17.37%, 5.21 g/L, and 39.56%, respectively. These results were consistent with other studies [36], which reported the potential of the species for bioethanol production but with slower substrate utilization compared to bacterial strains. Conversely, Escherichia coli showed the highest glycerol conversion rate of 80.54% and achieved an ethanol yield of 1.88%. In this context, a significant portion of glycerol was diverted to non-ethanol metabolites, as reported by Adnan et al. [37]. The research reported a similar trend, with Escherichia coli converting 80% of glycerol and yielding only 3.4% to reinforce the limited ethanol production efficiency despite high substrate utilization [38].
Other microbes, such as Pseudomonas aeruginosa, Saccharomyces cerevisiae, and Aspergillus sp., showed lower ethanol yields at 17.13%, 5.70%, and 2.31%, respectively. These observations were consistent with a previous study [39], which reported lower ethanol productivity of Aspergillus species due to a preference for secondary metabolites over ethanol. The structural integrity and metabolic activity of Serratia sp. during fermentation were validated through SEM. The results showed that Serratia sp. maintained a stable and healthy cell structure under conditions of high osmotic pressure and potential ethanol toxicity. This condition was consistent with Wang et al.’s research [14], who emphasized the robustness of Serratia sp. in challenging fermentation environments.
Figure 2 shows the HPLC chromatogram of the Serratia bacterial performance. The retention time of 11.19 minutes corresponds to a key metabolite produced during fermentation, potentially indicating ethanol synthesis. Meanwhile, the additional peaks observed at retention times of 9.924 and 12.980 minutes suggest the presence of intermediate compounds or byproducts. The chromatogram analysis confirms the production of bioethanol and provides insight into the metabolic pathways. The retention time at 11.19 minutes is consistent with reported values for ethanol, showing the successful conversion of glycerol into bioethanol under the conditions used.
3.3. Microbial Morphology, Structural Adaptations, and Optimization Potential
SEM was used to observe the structure of microorganisms after fermentation, enabling an evaluation of cell morphological changes due to the glycerol metabolism process. JEOL JSM 7610F SEM uses Field Emission Gun (FEG) technology, which enables high resolution and good contrast for detailed analysis of microbial samples. This high-resolution microscope provides a visualization of microbial surface structures, allowing a comprehensive observation of morphological changes and microbial interactions in the fermentation environment. SEM is essential for evaluating microbial adaptation to glycerol substrates and reporting structural variations during fermentation. Figure 3 shows the morphological structure ofSerratia at three different magnifications. At 2,500× (Fig. 3a), the colony exhibits an overall dense and tightly connected structure with visible pores and intercellular spaces that support glycerol fermentation activity. This adaptation allows for more efficient metabolite exchange and colony stability during fermentation.
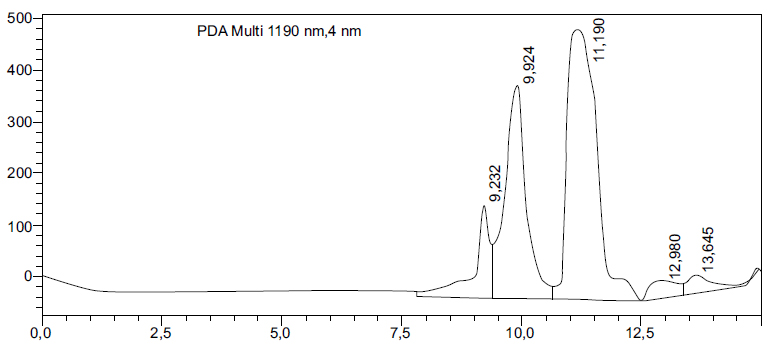
HPLC chromatogram showing the performance of Serratia bacteria in glycerol fermentation. A retention time of 11.19 minutes indicates ethanol production.
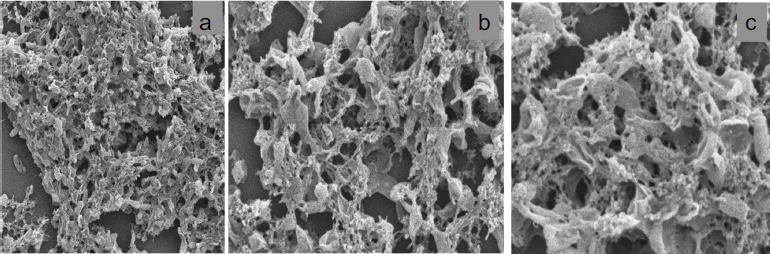
SEM test results of Serratia at different magnifications: (a) 2,500×, (b) 5,000×, and (c) 10,000×.
The pores and gaps between the colonies show environmental adaptations allowing Serratia cells to interact at 5000x magnification (Fig. 3b), and the structure of the intercellular network is visible. The bacterial colonies appear to adhere and bond to each other, forming denser aggregates in the fermentation environment used. Therefore, the details of the surface structure of the cell network are more visible at 10,000x magnification (Fig. 3c). Pores are visible on the colony walls, and magnification reveals a smooth surface layer with small spaces between bacterial colonies.
Microbes conduct cell remodeling to adapt and tolerate higher ethanol, as reported by Wang et al. [14]. Meanwhile, microbial cells act as fine fibers around the surface due to the shrinkage phase, which is common in the fermentation process caused by osmotic pressure and nutrient fluctuations [40]. Osmotic pressure occurs in the early fermentation phase, namely, the substrate with a high sugar content, while the final phase has a high ethanol content. The membrane blebbing phase is characterized by irregular protrusions to produce Bacterial Extracellular Vesicles (BEVs) and plays an important role during fermentation [41].
To enhance the ethanol productivity of Serratia sp., further optimization strategies can be considered, including strain improvement via mutagenesis or adaptive laboratory evolution, as well as metabolic engineering to redirect more carbon flux toward ethanol synthesis. Additionally, fermentation parameters such as aeration, agitation, and co-substrate supplementation (e.g., nitrogen sources or cofactors) can be fine-tuned to increase yield. Previous studies have also shown that immobilization techniques or co-cultivation with yeast could improve overall fermentation efficiency [37]. While Serratia sp. shows superior adaptability, it is also important to explore the potential of other isolates, such as Trichoderma sp. or Pseudomonas sp., by optimizing growth media, pH ranges, or implementing fed-batch strategies to support longer fermentation cycles. Such efforts would broaden the microbial candidates available for bioethanol production from glycerol and reduce reliance on a single strain.
3.4. FT-IR Spectroscopy Analysis of Ethanol Production
Ethanol spectrum analysis was performed using a PerkinElmer Frontier FT-IR with UATR. This instrument is capable of directly analyzing samples without complex preparation. It is suitable for non-destructive processes, such as confirming the presence of ethanol compounds through specific absorption peaks in the infrared spectrum. Figure 4 presents the FT-IR spectrum of ethanol produced by Serratia during glycerol fermentation at 40°C, pH 4–5, over 72 hours. The broad and intense absorption band at 3272.13 cm−1 corresponds to O–H stretching, a hallmark of alcohol functional groups. The band at 2889.7 cm−1 is attributed to C–H stretching from alkyl chains. The absorption near 1458.31 cm−1, although typically associated with –CH2 scissoring or bending vibrations, is often present in both glycerol and ethanol spectra. The band at 924.55 cm−1, commonly reported as an indicator of C–OH bending in secondary alcohols, overlaps with glycerol’s own strong absorptions, necessitating careful spectral interpretation.
To distinguish ethanol from residual glycerol, comparative reference spectra and prior literature were consulted. Previous studies [42] report that ethanol typically exhibits strong absorptions in the 3200–3300 cm−1 (O–H) and 2800–2900 cm−1 (C–H) regions, with moderate bands between 1000–1100 cm−1 for C–O stretching. Although some overlap exists with glycerol, the presence of all three defining features (O–H, C–H, and C–O) in conjunction with fermentation-specific shifts suggests the formation of ethanol. It is also noted that the ethanol assignments were further validated through parallel HPLC quantification.

FTIR spectrum of ethanol produced by Serratia during glycerol fermentation (T = 40 °C; pH = 4–5; 72 hours). The characteristic absorption bands correspond to OH stretching (3272.13 cm−1), C–H stretching (2889.7 cm−1), carbonyl C=O (1458.31 cm−1), C–OH bending (954.55 cm−1), and C–O stretching.
CONCLUSION
In conclusion, Saccharomyces cerevisiae and Serratia sp. showed superior fermentation performance, indicated by color changes and increased medium turbidity, reflecting elevated metabolic activity and effective adaptation to glycerol. Scanning Electron Microscopy (SEM) validated these findings by revealing structural integrity and morphological adaptations in Serratia sp. and S. cerevisiae, including pore formation and cell aggregation, which suggest tolerance to ethanol accumulation and osmotic stress. Additionally, morphological observations in Trichoderma sp. also indicated adaptation capabilities, although SEM images were less pronounced than in the top-performing strains. FT-IR analysis confirmed the presence of ethanol at an absorption peak of 3251.52 cm−1, showing successful bioconversion of glycerol into bioethanol. Quantitative analysis using HPLC showed that Serratia reported the best performance compared to Trichoderma, Pseudomonas aeruginosa, Yeast, Aspergillus, and Escherichia coli. Serratia survived in the fermentation environment of glycerol into bioethanol with a yield of 17.83%. These results provided a strong foundation for further research to optimize the use of Serratia.
Despite these promising results, this study has several limitations. The fermentation was conducted under a fixed set of laboratory conditions (30–40°C, pH 4–5, 3-day duration), which may not fully reflect industrial-scale applications or performance variability under different environmental conditions. Moreover, ethanol quantification was limited to endpoint analysis; dynamic monitoring of fermentation kinetics was not conducted. While SEM and FT-IR provided valuable structural and spectral insights, they do not quantify cellular viability or stress response at the molecular level. Future research should incorporate omics-based approaches, continuous fermentation systems, and scale-up validation to optimize bioethanol production from glycerol using Serratia sp. and other microbial candidates.
AUTHORS’ CONTRIBUTIONS
The authors confirm contribution to the paper as follows: H.R.: Conceptualization, methodology, writing, review editing, supervision, and funding; F.E.F.: Methodology, validation, data analysis, and curation; Y.W.: Methodology, validation, and data analysis; A.I. and N.N.: Preparation, experiment, and investigation. All authors have read and agreed to the published version of the manuscript.
LIST OF ABBREVIATIONS
| BEVs | = Bacterial Extracellular Vesicles |
| FT-IR | = Fourier-Transform Infrared Spectroscopy |
| GHG | = Greenhouse Gas |
| HPLC | = High-Performance Liquid Chromatography |
| LB | = Luria Bertani (medium) |
| LOD | = Limit of Detection |
| PDB | = Potato Dextrose Broth |
| PDA | = Potato Dextrose Agar |
| R2 | = Coefficient of Determination |
| SD | = Standard Deviation |
| SEM | = Scanning Electron Microscopy |
| UATR | = Universal Attenuated Total Reflectance |
ETHICS APPROVAL AND CONSENT TO PARTICIPATE
This study involved microbial cultures only and did not include any human participants or animal subjects. Therefore, ethical approval was not required in accordance with institutional and national research regulations.
AVAILABILITY OF DATA AND MATERIALS
The data supporting the findings of this article are available at the following link: https://drive.google.com/ drive/folders/1DMW05z6L1pfCnw5kmYG07bW_Uxzjkd7K?usp=sharing
FUNDING
This research was funded by the Research Technology–National Research and Innovation Agency (RISTEK–BRIN) under the Research Contract for the 2024 Fiscal Year, LLDIKTI Research Contract with Jayabaya University: 801/LL3/AL.04/2024, Researcher Research Contract: SP DIPA-105/E5/PG.02.00.PL/2024.
ACKNOWLEDGEMENTS
The authors are grateful to Research Technology-National Research and Innovation Agency (RISTEK-BRIN) for funding the research under the Research Contract for the 2024 Fiscal Year, Number: LLDIKTI research contract with Jayabaya University: 801/LL3/AL.04/2024, Researcher research contract SP DIPA-105/E5/PG.02.00.PL/2024.