All published articles of this journal are available on ScienceDirect.

Degradation of Aflatoxin M1 by Lipase and Protease in Buffer Solution and Yoghurt
Abstract
Objective:
This study aimed to examine the effectiveness of lipase and protease obtained from bacteria in the degradation of aflatoxin M1 (AFM1) in phosphate-buffered saline (PBS) and during the production of yoghurt.
Methods:
In this study, two strains, Levilactobacillus brevis and Lactobacillus plantarum, were used to produce protease and lipase, respectively. We then investigated the ability of protease and lipase to degrade AFM1 at four concentrations (50, 100, 150, and 200 U/ml for each enzyme) in vitro and during the preparation of yoghurt.
Results:
The results revealed that the highest activity was recorded at pH 7 and 7.5 for protease and lipase, respectively. As well, the optimum activity was observed at temperatures of 50 °C and 30 °C for protease and lipase, respectively. In vitro, the lipase enzyme at 200 U/ml degraded the AFM1 to 31.8, 37.4, and 56.7%, after incubating the PBS for 6, 12, and 18 h, respectively. Concerning protease, the means of degradation for AFM1 were 35.03, 43.7, and 72.9%, under the same conditions in yoghurt made from samples contaminated with 10 μg/L of AFM1, which was treated by both lipase and protease enzymes at 0.3, 0.6, and 0.9%, respectively. In yoghurt made from contaminated milk at 10 μg/L for AFM1, which was treated by 0.3, 0.6, and 0.9% of both lipase and protease, after two days of storage, the means of degradation of AFM1 were 23.4, 37.8, and 65.9%, respectively, which increased after five days to 27.3, 52.6, and 78.5%, respectively.
Conclusion:
Degradation of AFM1 was examined during the manufacturing of yoghurt using both bacterial lipase and protease without significantly affecting the sensory qualities of the finished product. Because of this, these enzymes could be a useful option in the biotech and dairy industries.
1. INTRODUCTION
Aflatoxin M1 (AFM1) is a monohydroxy derivative of aflatoxin B1 (AFB1) formed in the liver by a group of cytochrome P450 (CYP450) enzymes. AFM1 is excreted in human or animal milk after feeding on AFB1-contaminated food [1, 2]. According to Ayar et al. and Fink-Gremmels, the conversion rate of ingested AFB1 to AFM1 in milk is between 0.3 and 6.2%, depending on the degree of contamination as well as breed, health, type of diet, milk production, and rate of digestion [3, 4]. AFM1 has been identified by the International Agency for Research on Cancer as a group 1 human carcinogen. In order to preserve human health, many countries have established legal limits for AFM1 in milk and dairy products [5]. The European Commission regulation (165/2010) and the Egyptian standard permitted a level of 50 ng/kg for AFM1 in milk or processed dairy products. This limit is one order of magnitude lower than the 500 ng/kg limit set by the United States and the Codex Alimentarius [6, 7]. Additionally, AFM1 is stable during different processing steps of milk, such as pasteurization, cheese-making, and storage, and it can be detected in the final products, leading to the accumulation of AFM1 in the body as a result of eating contaminated dairy products [8]. According to Rahmani et al., numerous Middle Eastern nations have cow milk and milk products, including yoghurt, which have been contaminated with AFM1. Numerous studies have used enzymes for the enzymatic degradation of mycotoxins, like aflatoxins, zearalenone, ochratoxin A, and deoxynivalenol through the biotransformation of toxins [9-13]. According to Loi et al., the Ery4 laccase isolated from Pleurotus eryngii may simultaneously degrade AFB1, OTA, fumonisins, zearalenone, and T-2 [14]. Also, the carboxypeptidase cloned from the bacterium is able to degrade OTA by up to 72% [15]. Accordingly, there is a necessary and urgent need to find an effective and safe method for the degradation or removal of AFM1. Enzymes are one of the most promising methods in this field. This may be due to the fact that enzymes allow a specific, most likely irreversible, environmentally friendly, and effective approach with a minor impact on food sensory and nutritional quality [16]. Due to the widespread consumption of yoghurt and the possibility of lifelong exposure, AFM1 will undoubtedly continue to be important to yoghurt processors and governments interested in controlling the quality of yoghurt and dairy products. Therefore, this study aimed to screen some biochemical characterization of lipase and protease enzymes produced by Lactobacillus plantarum and Levilactobacillus brevis, respectively, and then evaluate the efficacy of these enzymes in the degradation of AFM1 in phosphate-buffered saline (PBS) and during the preparation of yoghurt.
2. MATERIALS AND METHODS
2.1. Chemicals
The AFM1 standard was purchased from Sigma Chemical Company (St. Louis, MO, USA). Afla M1TM HPLC was obtained from VICAM (Watertown, MA, USA). All solvents (HPLC grade) were purchased from Merck (Darmstadt, Germany). Water Millipore Milli-Q system was obtained from Millipore (Bedford, MA, USA).
2.2. Preparation of Strains Used to Produce Enzymes
In this study, two strains, Levilactobacillus brevis and Lactobacillus plantarum, were used to produce protease and lipase, respectively. These strains were isolated from some soft cheese and identified using the -50CHL API-20STREP identification system (BioMerieux) according to Bergey’s Manual of Systematic Bacteriology (2009) [17]. In another study, we performed the production, extraction, partial purification, and characterization of these enzymes [13].
2.3. Determination of Some Biochemical Characteristics Affecting Enzyme Activity
Enzyme activity is affected by a number of factors, such as temperature, pH, and salt concentration. So, we determined the optimum pH according to the method proposed by Gomori (1955), as well as temperature, thermal stability, and the concentration of sodium chloride (NaCl) and some metal ions [18, 19].
2.3.1. Optimum Temperature
The optimum temperature for lipase and protease was determined at different temperatures ranging from 0 to 100 °C for 10 min by incubating the reaction mixture. The optimal temperatures were determined at each temperature.
2.3.2. Thermal Stability
Lipase and protease enzymes were heated for 15, 30, 45, and 60 min in water baths with temperature settings ranging from 30 to 100 °C. After quickly cooling to 37 °C, the enzyme activity was immediately tested [20].
2.4. Degradation Assay of AFM1 in Contaminated PBS
We investigated the ability of protease and lipase to degrade AFM1 at four different concentrations (50, 100, 150, and 200 U/ml for each enzyme) using phosphate-buffered saline (PBS) contaminated by AFM1 at 10 µg/L. The enzyme was added to 100 ml of contaminated PBS and AFM1, and the samples were incubated at 37 °C for 6, 12, and 18 h. AFM1 was extracted and determined for each dose and incubation period. All treatments had three replicates for each incubation time and enzyme. After incubation, 5 ml of PBS was passed through the Afla M1TM column, followed by washing with 20ml of distilled water. Then, AFM1 was eluted with 1.5ml of acetonitrile, followed by 1.5ml of distilled water, and collected in a clean vial. According to AOAC (2005), the eluate was evaporated, and then AFM1 was determined by HPLC as follows: 200 µL of hexane and 200 µL of trifluoroacetic acid were added to the dry residue in the vial, and the mixture was kept stable for 10 min at 40°C, and then evaporated to dryness. The residue was dissolved in 2 mL of water and acetonitrile (75 + 25) for injection by HPLC instrument with a quaternary pump fluorescence detector system set at 365 nm excitation and 435 nm emission wavelengths, with the mobile phase consisting of water: methanol: acetonitrile (66:17:17). The separation was carried out at 40 °C with a flow rate of 1 ml/min [21].
2.5. Assay of AFM1 in Yoghurt and Evaluation of its Chemical and Physical Properties
Cow’s milk (fat 3%) spiked with AFM1 at 10µg/L was heated to 90 °C, held for 5 min, and then cooled to 45°C. This was followed by inoculation with 1.0% w/v of Streptococcus thermophilus and Lactobacillus bulgaricus. The samples were divided into eight groups as follows:
Group 1: Control sample of milk without AFM1 and any enzyme.
Group 2: Positive sample of milk contaminated by AFM1 without any enzyme.
Group 3: Milk contaminated by AFM1 and treated with 0.3% of both lipase and protease.
Group 4: Milk contaminated by AFM1 and treated with 0.6% of both lipase and protease.
Group 5: Milk contaminated by AFM1 and treated with 0.9% of both lipase and protease.
Group 6: Milk free from AFM1 and treated with 0.3% of both lipase and protease.
Group 7: Milk free from AFM1 and treated with 0.6% of both lipase and protease.
Group 8: Milk free from AFM1 and treated with 0.9% of both lipase and protease.
The infected mixtures were completely blended, transferred to 100 ml plastic cups, and incubated at 40°C until homogeneous coagulation was produced.
Groups 1, 6, 7, and 8 were subjected to chemical analysis and sensory evaluation at baseline when they were fresh, and 5, 10, and 15 days of storage at 5±2°C [22]. The percentage of AFM1 degradation was calculated for groups 2, 3, 4, and 5 after storing the samples for two and five days as follows:
The percentage of degradation of

Where, C is the concentration of AFM1 in the positive sample (group 2) and T is the concentration of AFM1 in the treatment groups (groups 3, 4, and 5). AFM1 was extracted according to the method proposed by Corassin et al. [23] and then determined by HPLC as mentioned earlier.
2.6. Chemical Analysis of Affected Yoghurt by Enzymes
According to the procedures outlined in AOAC (2012), the contents of ash, fat, total nitrogen (TN), titratable acidity (TA), and moisture were all measured [24]. According to Less and Jago (1970), the yoghurt samples' acetaldehyde and diacetyl levels were assessed using a Shimadzu spectrophotometer (240-UV-Vis, Japan) [25]. A digital pH meter (HANNA, instrument, Italy) was used to measure the pH.
2.7. The Evaluation of Sensory Properties of Yoghurt-free AFM1 and that Affected with Enzymes
Using the scorecard proposed by Bodyfelt et al., yoghurt samples were assessed for their sensory qualities, including the appearance (10 points), body and texture (40 points), and flavor (50 points). The personnel at the NRC, Egypt's Dairy Science Department, judged the sample [26].
2.8. Statistical Analysis
The SPSS version 18 (IBM Corp., NY) general linear model approach was employed for the statistical analysis. The Waller-Duncan k-ratio was used to determine the significance of the differences among the treatments. All statements of significance that depended on the probability of a P-value ≤0.05 were considered to be statistically significant. Values represent average standard deviations for triplicate experi-ments.
3. RESULTS AND DISCUSSION
3.1. The Optimal pH Values and Temperatures of the Protease and Lipase Enzymes
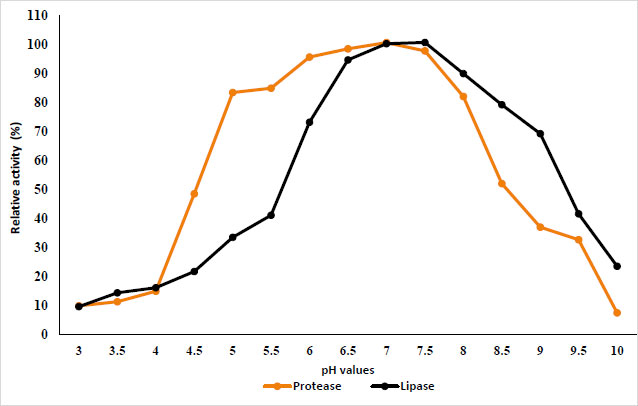
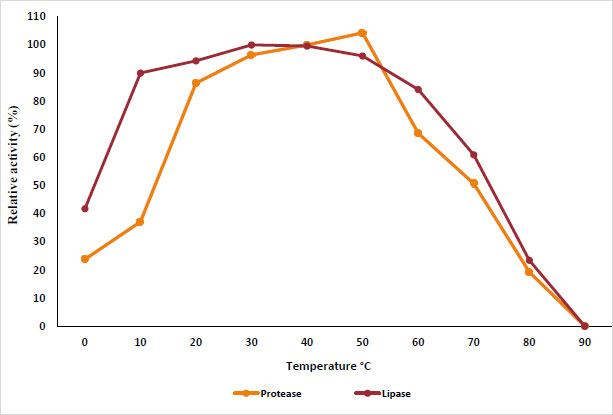
The results in Fig. (1) show the effect of different pH values from 3 to 10 on protease and lipase activity. The results show that protease retains its activity in the pH range of 5.0 to 8, while lipase retains its activity in the pH range of 5.5 to 9; the highest activity was recorded at pH 7 and 7.5 for protease and lipase, respectively. On the other hand, Fig. (2) shows the effect of different temperatures from 0 to 100 °C on purified protease and lipase activity. Protease and lipase enzyme activity increased as the temperature increased from 10 to 50°C. The results indicated the optimum activity at temperatures of 50°C and 30°C for protease and lipase, respectively. The activity decreased as the reaction temperature increased above 70°C due to the thermal denaturation of the protein.
3.2. Thermal Stability of Protease and Lipase Enzymes
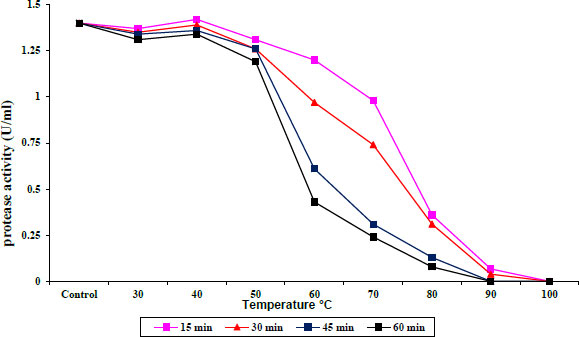
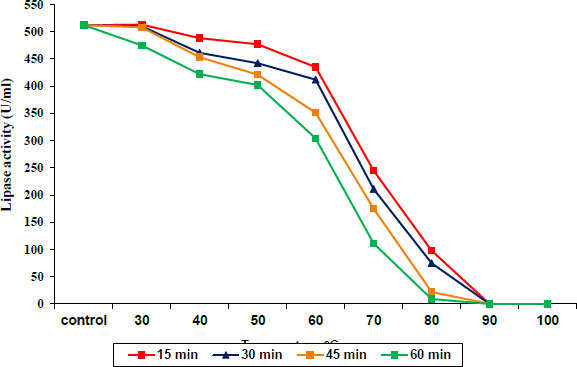
The protease and lipase enzyme activities were stable at temperatures from 30 to 40°C and 30 to 50°C, respectively, for 15–60 min of incubation, and then slightly decreased at 50 and 60 °C for protease and lipase, respectively. Incubation at 60 to 80°C caused a decrease in protease activity until it was completely absent at 90°C, as shown in Fig. (3), while lipase exhibited a sharp decrease in activity during incubation at 70 to 80°C at all times until the complete disappearance of enzyme activity at 90°C (Fig. 4).
3.3. Impact of NaCl on the Activity of Protease and Lipase Enzymes
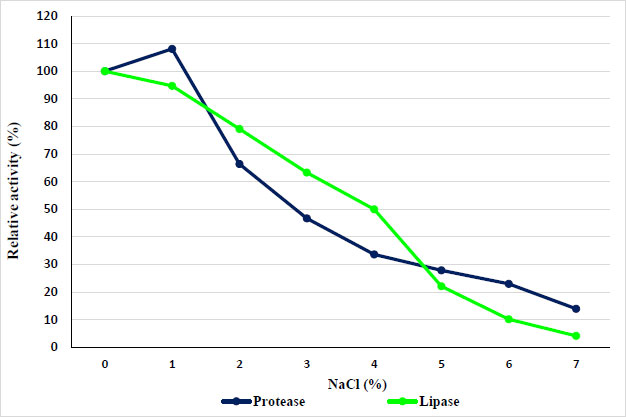
The concentration of sodium chloride in the solution limits the enzyme's ability to function. Depending on the concentration, salts can either activate or deactivate the enzyme through interactions in the enzyme's tertiary structure, which would be disrupted if the salt concentration is too high or too low [19]. So, this study evaluated the effects of different concentrations of NaCl (0–7%) on the activity of protease and lipase. Results showed a gradual reduction in protease activity when increasing the NaCl concentration. As shown in Fig. (5), increasing the concentration of NaCl with increasing protease activity (even 1% sodium chloride) caused the enzyme activity to decrease gradually with increasing concentration of sodium chloride, and then a sharp decline in the activity of the enzyme up to 7% has been observed. While lipase activity gradually reduced with increasing NaCl concentration.
3.4. Effect of Various Metal Ions and other Materials on Protease and Lipase Enzymes
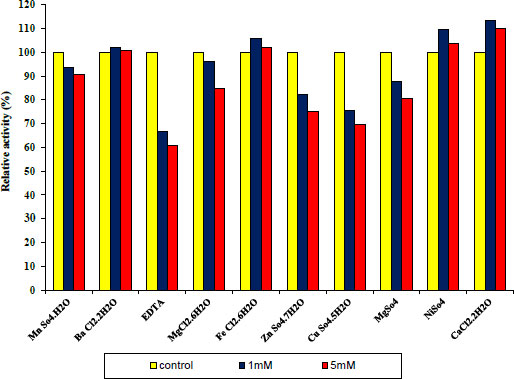
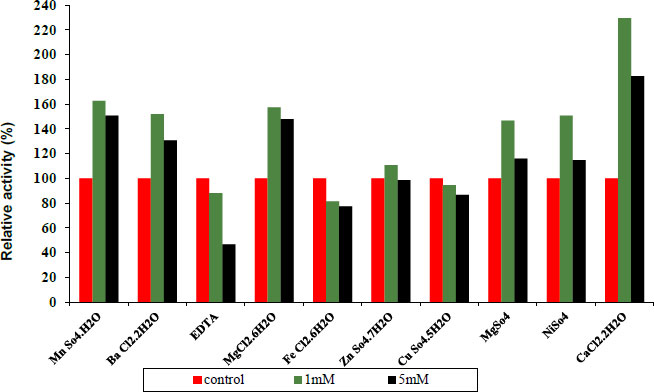
Under conventional assay conditions, chlorides and sulphates at concentrations of 1 and 5 mM each were used to examine the impact of monovalent and divalent ions on enzyme activity. Variable metal ions always have varied impacts on pure protease activity. Some metal ions and other materials were added at different concentrations of 1 and 5 mM, as shown in Fig. (7) indicating 1 and 5 mM Fe+2, Cu+2, and EDTA to act as inhibitors. Whereas MN+2, Ba+2, Ni+2, Mg +2, Zn+2 and CaCl2 have been observed to be activators of the purified protease enzyme and in Fig. (6) indicating 1 and 5 mM Ba+2, Fe+2, Ni+2 and CaCl2 to act as activators. Whereas Mn+2, EDTA, Mg+2, Zn+2 and Cu+2 have been observed to be inhibitors of the purified lipase activity. Finally, the ability of an enzyme to tolerate different metal ions is essential for both its mechanisms of action and some of its industrial uses.
Concerning the structure and operation of enzymes, metal ions play a vital role. Enzyme activity may be altered by metal ions that modify enzyme conformation. They might act as cofactors in catalytic processes or create interactions with the side chains of amino acids in proteins, denaturing the structure of the enzyme and preventing it from doing its function [27].
3.5. Effectiveness of Protease and Lipase Enzymes in Degrading AFM1
3.5.1. In vitro Degradation of AFM1 by Lipase and Protease
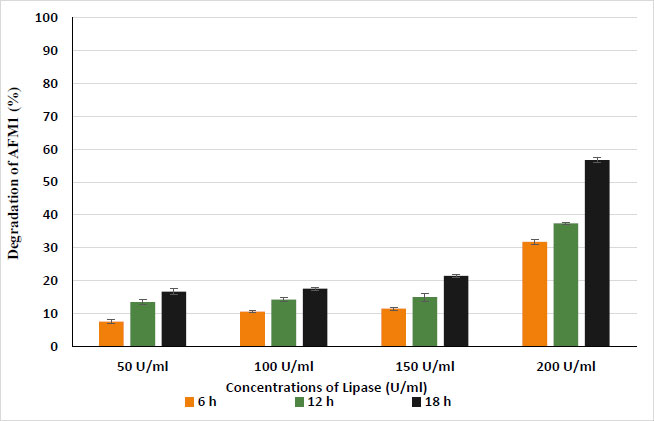
Data presented in Fig. (8) show the percentages of degradation of AFM1-contaminated PBS at 10 µg/L after treatment by lipase enzyme at gradually increasing concentrations ranging from 50 to 200 U/ml that were incubated for 6, 12, and 18 h at 37°C. The results indicated that lipase enzymes degraded AFM1 to 7.6, 13.5, and 16.7% after treatment with 50 U/ml for 6, 12, and 18 h, respectively. Also, the results indicated that treatment at 100 U/ml with lipase degraded AFM1 to 10.6, 14.3, and 17.6% at the same incubation time. While the high concentration of lipase enzyme (200 U/ml) increased the percentages of degradation of AFM1 to 31.8, 37.4, and 56.7% after incubation in PBS for 6, 12, and 18 h, respectively, according to the obtained results, the degradation increased with increasing concentration of lipase enzyme and time of incubation. The ANOVA analysis of variance for the effect of lipase and protease on the degradation of AFM1 showed that treatments by enzymes have a significant effect on the content of AFM1, which depends significantly on both the concentration of enzyme and the time of incubation (Tables 1 and 2). Pure laccases from P. pulmonarius and -P. eryngii were used by Loi et al. for both AFB1 and AFM1. The authors performed in vitro and matrix tests with 1 µg/mL of AFB1 and 0.05 ug/mL of AFM1. Interestingly, they reported that, while laccases alone are poorly able to degrade these toxins, the addition of a redox mediator at a 10 mM concentration increased the degrading percentages from 23% up to 90% for AFB1 and up to 100% for AFM1 after 72 h [28, 29]. In addition, Guan et al. reported that pure Myxobacteria aflatoxin degrading enzyme (MADE) at 100 U/mL was tested towards 0.1 ug/mL each of aflatoxin G1 and AFM1, achieving 98 and 97% degradation after 48 h of incubation [30].
| Source | SS | df | MS | F | P |
|---|---|---|---|---|---|
| Intercept | 16180.82 | 1 | 16180.82 | 18955.4 | 0.000000 |
| Time of incubation (T) | 994.0338 | 2 | 497.0169 | 582.2421 | 0.000000 |
| Con. of the enzyme (C) | 5226.631 | 3 | 1742.21 | 2040.953 | 0.000000 |
| T*C | 379.0637 | 6 | 63.17729 | 74.01052 | 0.000000 |
| Error | 20.48702 | 24 | 0.853626 | - | - |
| Total | 22801.03 | 36 | - | - | - |
| Source | SS | df | MS | F | P |
|---|---|---|---|---|---|
| Intercept | 31742.17 | 1 | 31742.17 | 2722.356 | 0.000000 |
| Time of incubation (T) | 4490.737 | 2 | 2245.369 | 192.5732 | 0.000000 |
| Con. of the enzyme (C) | 5754.17 | 3 | 1918.057 | 164.5014 | 0.000000 |
| T*C | 583.7392 | 6 | 97.28986 | 8.34403 | 0.000000 |
| Error | 279.8356 | 24 | 11.65982 | - | - |
| Total | 42850.66 | 36 | - | - | - |
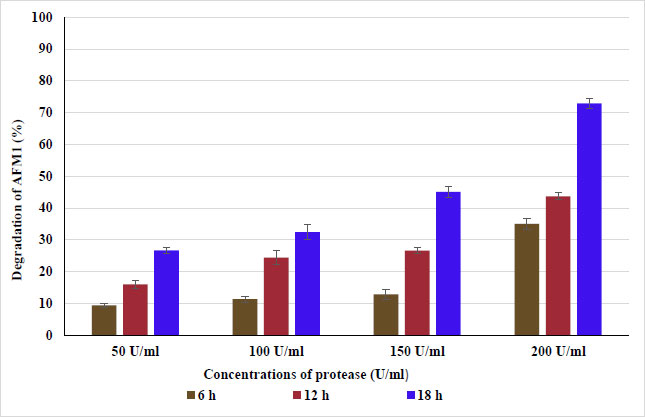
Data presented in Fig. (9) show the percentage of degradation of AFM1 in PBS contaminated by AFM1 (10 g/L). AFM1 was degraded to 9.4, 16., and 26.7% after treating PBS with 50 U/ml of protease enzyme at 37°C for 6, 12, and 18 h, respectively. As well, protease at 100 U/ml for 6, 12, and 18 h degraded AFM1 to 11.3, 24.4, and 32.4%, respectively. While an increase in degradation of AFM1 was observed with 150 and 200 U/ml of protease enzyme, it was 45.1 and 72.9% after incubation for 18 h, respectively. The results showed that lipase and protease could be used to remove or degrade AFM1 to reach acceptable levels. To increase the safety of dairy products, this must be applied to the elimination of AFM1 from milk and milk products. The techniques for degrading mycotoxin also exhibited efficiency when using the enzymes and metabolites of microorganisms. Mycotoxins can be metabolized, destroyed, or inactivated by microbial enzymes into less harmful or harmless metabolites, according to Lyagin and Efremenko. Degradation may also occur due to a variety of biochemical transformation processes, such as acetylation, glucosylation, ring breakage, hydrolysis, sulfation, deamination, and decarboxylation [12, 16]. According to several studies, microbial enzymes have an impact on the lactone ring, which provides fluorescence properties; breaking the lactone ring results in a non-fluorescent molecule with much lower biological activity. The ring cleavage of lactones, however, takes place via hydrolysis as opposed to oxidation [28, 31, 32]. Finally, microbial enzymes' attractiveness and environmental friendliness make them potential alternatives to chemical and physical approaches for mycotoxin breakdown [33]. The majority of enzymes, however, are unable to survive high temperatures, which makes them unsuitable for industrial uses [34]. Therefore, thermostability is a key feature of industrial enzymes, and in order to meet industrial demands, efforts should also be made to provide highly thermostable enzymes. These enzymes can lower production costs, increase productivity, and aid in reducing microbial contamination in industrial processes.
3.5.2. Impact of Enzymes on AFM1 during the Preparation of Yoghurt
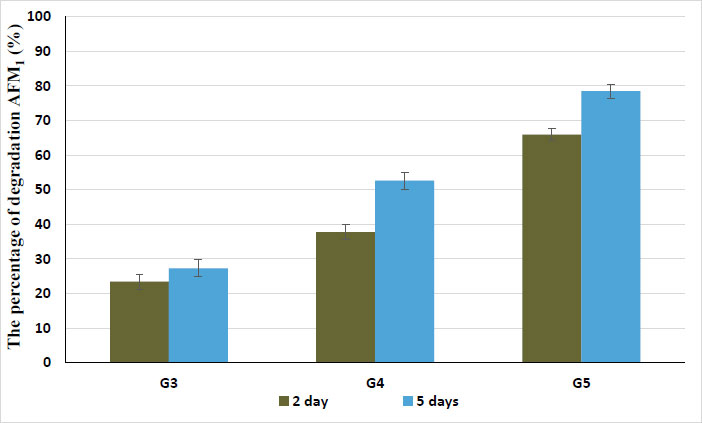
In yoghurt made from samples contaminated with 10 ug/L of AFM1, which was treated by both lipase and protease enzymes at 0.3, 0.6, and 0.9%, the data shown in Fig. (10) reveal the degradation of AFM1 in yoghurt samples after storage for 2 and 5 days. After two days, degradation occurred at rates of 23.4, 37.8, and 65.9%. The highest rate of degradation (65.9%) was observed with the addition of 0.9% of both lipase and protease during the preparation of yoghurt. Also, the AFM1 degraded to 27.3, 52.6, and 78.5% in yoghurt samples that were stored for five days. The rate of AFM1 degradation in milk and milk products has been found to vary between studies, which may be caused by variations in the extraction techniques used, the toxin concentration, the amount of time before analysis, the storage temperature, the way milk is contaminated, the variability in the composition of the milk, or the behavior of starter cultures used to make yoghurt [35]. AFM1 may degrade in yoghurt during the storage period due to the oxidation of glucose-by-glucose oxidase as a catalyst. The hydrogen peroxide (H2O2) and gluconolactone presented by the oxidation of glucose are present in yoghurt. And this H2O2 produces singlet oxygen, which is a highly reactive electrophile. This reactive oxygen may react with the double bond in the terminal dihydrofuran moiety of the AFM1 molecule. On the other hand, gluconolactone can be hydrolyzed to create gluconic acid, and this acid can lower the pH of yoghurt, which can cause AFM1 to be destroyed. On the other hand, El-Deeb et al. stated that enzymes, microbes, and particularly acid coagulation cause the degradation of AFM1 in milk [35-37].
3.6. Influence of Adding Enzymes on Some Chemical Characteristics of Yoghurt
The pH decreased on days 5 and 10, as shown in Table 3, but the subsequent drops were not statistically significant (P > 0.05) for the remainder of the storage period. All yoghurt samples underwent the same rate of pH lowering (p ≤ 0.05) during storage. Ozer et al. and Barros et al. reported that during fermentation, the initial pH of milk declined while titratable acidity rose in treatments [38, 39]. The pH of the control and each of the G6, G7, and G8 were the same (P ≤ 0.05). As a result, adding pure enzyme extract had no effect (P ≤ 0.05) on the fermentation process or the outcome. Changes in the acidity of yoghurt using cow’s milk treated with different concentrations from purified protease and lipase enzymes have been observed. All yoghurt samples with different concentrations of purified protease and lipase enzymes and starter culture exhibited obviously higher acidity values than those in control. According to Corrieu and Beal, the growth of lactic acid bacteria in milk causes yoghurt to undergo a number of favourable alterations. These modifications include the creation of several metabolites, like lactic acid, exopolysaccharides, and fragrance compounds, as well as adjustments to the product's texture and nutritional content [40]. The results showed that TN and moisture rose over the course of storage, but that there was no discernible difference (P ≤ 0.05) between the control and any of the treatments. Thus, neither the yoghurt's total protein content nor its moisture content was affected by the addition of purified protease and lipase enzyme extracts (P ≤ 0.05). The acquired results also showed that during the experiment, there was no observed rise in ash, and that there were substantial changes in fat between the control and all treatments.
| Parameter | Treatments | Storage Period (days) | SE | |||
| Fresh | 5 | 10 | 15 | |||
| pH | G1 | 4.83a | 4.71b | 4.65c | 4.62d | 0.004 |
| G6 | 4.85a | 4.75b | 4.68c | 4.67c | 0.49 | |
| G7 | 4.91a | 4.81b | 4.75c | 4.65d | 0.006 | |
| G8 | 4.83a | 4.77b | 4.60c | 4.58d | 0.005 | |
| Acidity | G1 | 0.70c | 0.78b | 0.80b | 0.84a | 0.011 |
| G6 | 0.69c | 0.73b | 0.81a | 0.83a | 0.014 | |
| G7 | 0.75c | 0.84b | 0.87ab | 0.93a | 0.020 | |
| G8 | 0.70d | 0.81c | 0.83b | 0.88a | 0.013 | |
| Moisture | G1 | 86.74a | 86.42a | 86.39b | 86.35c | 0.13 |
| G6 | 86.67a | 86.63b | 86.56c | 86.45d | 0.012 | |
| G7 | 86.71a | 86.67a | 86.59b | 86.45c | 0.012 | |
| G8 | 86.38a | 86.35a | 86.28c | 86.17d | 0.009 | |
| TN | G1 | 0.64c | 0.64c | 0.65b | 0.66a | 0.005 |
| G6 | 0.62d | 0.63c | 0.66b | 0.68a | 0.004 | |
| G7 | 0.62d | 0.65c | 0.68b | 0.69a | 0.004 | |
| G8 | 0.63d | 0.65c | 0.66b | 0.69a | 0.010 | |
| Fat | G1 | 3.13a | 3.13a | 3.3.11a | 3.10a | 0.006 |
| G6 | 3.13a | 3.06b | 2.97c | 2.86d | 0.033 | |
| G7 | 3.11a | 2.80b | 2.70c | 2.63d | 0.057 | |
| G8 | 2.83a | 2.53b | 2.47c | 2.43d | 0.052 | |
| Ash | G1 | 0.76b | 0.77ab | 0.77ab | 0.78a | 0.004 |
| G6 | 0.78c | 0.79bc | 0.80b | 0.82a | 0.009 | |
| G7 | 0.76b | 0.78b | 0.80ab | 0.82a | 0.004 | |
| G8 | 0.78d | 0.84c | 0.81b | 0.83a | 0.006 | |
| Acetaldehyde (µmol/100 g yoghurt) | G1 | 16.67a | 15.66b | 14.65c | 13.93d | 0.09 |
| G6 | 20.73a | 18.66b | 17.04c | 15.95d | 0.16 | |
| G7 | 21.26a | 18.66b | 17.98c | 16.35c | 0.31 | |
| G8 | 23.05a | 21.67b | 19.40c | 17.39d | 0.73 | |
| diacetyl (µmol/100 g yoghurt) | G1 | 2.47c | 6.24b | 8.95a | 9.70a | 0.43 |
| G6 | 1.86d | 4.92c | 7.68b | 9.90a | 0.33 | |
| G7 | 1.42d | 5.26c | 8.25b | 9.80a | 0.38 | |
| G8 | 2.49d | 6.18c | 7.74b | 9.21a | 0.40 | |
| Characteristics | Storage Period (days) | Groups Samples | |||
| G1 | G6 | G7 | G8 | ||
| Appearance (10 points) | F | 7.56ab | 8.37a | 7.37a | 6.25a |
| 5 | 7.52a | 8.25a | 7.18b | 6.41a | |
| 10 | 6.83bc | 7.73ab | 6.70c | 5.95ab | |
| 15 | 6.29c | 7.26b | 6.20d | 5.22b | |
| SE | 0.13 | 0.20 | 0.10 | 0.24 | |
|
Body and texture (40 points) |
F | 36.87a | 37.33a | 37.33a | 34.00a |
| 5 | 36.56ab | 36.66ab | 36.53ab | 33.33a | |
| 10 | 36.06ab | 36.17bc | 36.33bc | 32.39b | |
| 15 | 35.51b | 35.83c | 35.17c | 33.00b | |
| SE | 0.28 | 0.20 | 0.16 | 0.16 | |
|
Flavor (50 points) |
F | 44.20a | 47.36a | 46.41a | 45.40a |
| 5 | 43.90a | 47.20a | 46.28a | 45.23a | |
| 10 | 43.70b | 46.91a | 46.26a | 44.42b | |
| 15 | 43.33b | 46.73b | 46.23a | 44.26b | |
| Total score (100 points) | F | 88.64a | 93.07a | 91.11a | 86.05a |
| 5 | 87.98a | 92.12b | 90.00b | 84.98a | |
| 10 | 86.54b | 90.82b | 89.30c | 82.76b | |
| 15 | 85.13b | 89.83c | 87.60d | 82.48b | |
| SE | 0.57 | 0.31 | 0.24 | 0.31 | |
3.6.1. Acetaldehydes and Diacetyl Content
All treatments showed no significant difference in the acetaldehyde content compared to the control at the fresh stage or during period storage, after which the increase was significant between G7 and other treatments at 15 days. A gradual decrease in the concentration of acetaldehyde was observed until day 15, and in the diacetyl content compared to the control at 0, 5, 10, and 15 days of storage; however, no significant change in the concentration of diacetyl between all yoghurt samples was observed when they were fresh. After 5, 10, and 15 days, the increase was significant between control and all treatments. According to Gilliland, the quick pH drop caused by the development of streptococci in mixed cultures increases the formation of diacetyl [41]. The results of acetaldehyde and diacetyl concentration during storage have been found to be consistent with Vahcic and Hruskar, who discovered that acetaldehyde and ethanol content decreased throughout a 25-day storage period at temperatures of 4, 20, and 37°C [42]. The high concentration of enzyme extract and starting culture, which may convert acetaldehyde to ethanol and thus boost the formation of diacetyl, may explain our acquired amounts of acetaldehyde and diacetyl.
3.7. Sensory Properties
According to the results shown in Table 4, there was no discernible change between the sensory characteristics’ scores (appearance, body, texture, and flavour) for all treatments at the fresh stage and after five days from storage compared to the control. During the storage time, there was a noticeable difference in the appearance, body, texture, and flavour between G8 and control, with the sensory attributes score in G8 being lower. Starch and pectin were found to significantly reduce the amount of aroma molecules in the headspace when present in yoghurt [43, 44]. Traditional yoghurt has a weak body (gelatinous body) and a sweet flavour, which may mask the pleasantly acidic flavour. It is manufactured with a 0.3% level of purified enzymes (G6). The sensory qualities were found to somewhat deteriorate during cold storage. Similar findings were obtained by Zhao and Routray and Mishra, who found that the amount of time yoghurt was stored had a negative impact on the flavour rating [45, 46]. As a result, sensory quality declined with time and it was found to be closely correlated with variations in the composition of scent components. These findings suggest that a viable starting point for the production of nutritional and therapeutic yoghurt could be the addition of 0.3% or 0.6% of purified enzymes.
CONCLUSION
The results have shown the highest activity for protease and lipase to be at pH 7 and 7.5, respectively. The optimum reaction temperatures for the protease and lipase were 50 °C and 30 °C, respectively. These enzymes were stable at temperatures ranging from 30 to 50°C for incubation times ranging from 15 to 60 min.On the other hand, the results indicated Fe+2, Cu+2, and EDTA at 1 and 5 mM to act as inhibitors for protease. While, Mn+2, EDTA, Mg+2, Zn+2 Cu+2 as inhibitors of lipase activity. In addition, on the other side, MN+2, Ba+2, Ni+2, Mg+2, Zn+2, and CaCl2 were activators of the purified protease and Ba+2, Fe+2, Ni+2and CaCl2 as activators for lipase. The AFM1 degraded after incubating PBS at 37 °C for 18 hours to 16.7, 17.6, and 56.7% after being treated with 50, 100, and 200 U/ml. After two days, the addition of 0.9% of both lipase and protease during the manufacture of yoghurt resulted in the highest rate of degradation (65.9%). Additionally, after five days of storage, the AFM1 decreased to 27.3, 52.6, and 78.5% in yoghurt samples, respectively. Therefore, these enzymes may be used as an efficient choice in dairy products, food, and biotechnological industries. In addition, these enzymes have shown high activity, which enabled the degradation of AFM1 in yoghurt without having a significant effect on the sensory properties of the final product.
LIST OF ABBREVIATIONS
| AFM1 | = Aflatoxin M1 |
| CYP450 | = Cytochrome P450 |
| PBS | = Phosphate-buffered saline |
| NaCl | = Sodium chloride |
ETHICS APPROVAL AND CONSENT TO PARTICIPATE
Not applicable.
HUMAN AND ANIMAL RIGHTS
No humans/animals were used for studies that are the basis of this research.
CONSENT FOR PUBLICATION
Not applicable.
AVAILABILITY OF DATA AND MATERIALS
The data supporting the findings of this research are available in the manuscript.
FUNDING
None.
CONFLICT OF INTEREST
The authors declare no conflict of interest, financial or otherwise.
ACKNOWLEDGEMENTS
The authors sincerely thank the National Research Centre, Egypt (Project No. 120403) for support during this study.