All published articles of this journal are available on ScienceDirect.

Simultaneous Determination of Penicillin G and Chloramphenicol in Milk by a Magnetic Nanoparticle-Based Fluorescent Immunoassay
Authors Info & Affiliations
Abstract
Background:
Antibiotic residues are a problem of increasing importance and have direct consequences for human and animal health. The frequent use of antibiotics in veterinary practice causes their excretion in milk in dairy cattle. This way, they can easily enter the human body through the consumption of milk and dairy products.
Objectives:
This induces the need for accurate and sensitive methods to monitor antibiotic levels in milk. The aim of this study was to develop a rapid and sensitive magnetic nanoparticle-based fluorescence immunoassay for the simultaneous detection of chloramphenicol and penicillin G in milk.
Methods:
Magnetic nanoparticles were synthesized and functionalized with (3-aminopropyl)triethoxysilane. Chloramphenicol-Ovalbumin and Chloramphenicol-Ovalbumin-Fluorescein-5-isothiocyanate conjugates were prepared. Penicillin G – ATTO 633 fluorescent conjugate was synthesized. Antibodies against chloramphenicol and penicillin G were immobilized onto the magnetic nanoparticles. The competitive fluorescent immunoassay was developed. The optimal concentration of the antibody-magnetic nanoparticles and the fluorescent conjugates for the assay was determined. The calibration curves for the antibiotics in buffer and milk were plotted. Fluorescent immunoassay for the simultaneous determination of chloramphenicol and penicillin G in milk was developed.
Results:
The limit of detection by the simultaneous immunoassay of chloramphenicol and penicillin G in milk was 0.85 ng/mL and 1.6 ng/mL, respectively. The recovery of different concentrations of chloramphenicol and penicillin G in milk samples varied from 98% to 106%.
Conclusions:
A rapid and sensitive magnetic nanoparticle-based immunofluorescent assay for the simultaneous determination of chloramphenicol and penicillin G in milk was developed. The magnetic nanoparticles ensured rapid and easy procedure.
1. INTRODUCTION
Antibiotics are widely used for disease prevention and treatment as well as growth promotion in animal husbandry [1]. Unfortunately, the use of antibiotics, especially if not used according to label directions, can result in drug residues in animal-origin food such as milk. The occurrence of antibiotics in the food samples at trace levels (in the range of nanograms to low micrograms per liter) has been widely discussed and published in the literature [2, 3]. To ensure food safety, authorities in charge of the control of residues have established Maximum Residue Limits (MRLs) for some animal-derived food items, including bovine milk [4, 5]. Specifically, for penicillin, the European Union has established MRLs of 4 µg/kg and chloramphenicol is listed as a forbidden chemical. The MRLs of chloramphenicol established in Russia for milk, meat, and eggs are 10 µg/kg [6].
Low MRLs necessitate highly sensitive methods for detecting antibiotics. Control of antibiotics in food products requires rapid analysis methods and needs to be implemented directly at sampling points. However, stationary methods are still predominant in the state-of-the-art analytical practice. The most used conventional methods for the detection of antibiotics are instrumental [7], such as capillary electrophoresis [8, 9], gas chromatography [10, 11], and liquid chromatography [12] coupled with mass spectrometry [13]. However, these methods are expensive and present limitations, such as the need for expensive laboratory instruments, time-consuming separation/clean-up methodologies, long analysis time, extensive sample handling with multiple washing steps, use of expensive and polluting solvents and the impossibility to perform field analyses, making necessary the development of new methods to overcome these limitations [14]. In contrast, immunoassays based on specific antibody recognition are a rapid method of screening samples [15]. They are simple, fast selective, sensitive, and low-cost assays. Several traditional Enzyme-Linked Immunosorbent Assays (ELISA) with colorimetric detection have been developed to detect penicillin [16, 17] and chloramphenicol [18, 19]. Although fluorescent detection is more sensitive than colorimetric one, few fluorescent immunoassays were described [20]. Fluorescent immunoassay permits to perform multiplexed analyses [21, 22]. The ability to measure simultaneously multiple analytes in a single assay offers several advantages, such as higher throughput compared to single-target systems, savings in reagents and consumables, and decreased sampling errors. Compared to ELISA, the multiplexed assay had a similar limit of detection, but its ability to simultaneously measure several analytes in a single sample is superior to ELISA [22].
On the other hand, the integration of nanomaterials, such as nanomagnetic beads into immunoassays has important advantages [23-25]. The Magnetic Nanoparticles (MNPs) are preferred for the preparation of microbed assay because they propose an easy separation by an external magnetic field, enhanced signal due to large surface-to-volume ratio; pseudo-homogenic reaction (which are faster than the heterogenic reaction); and greater precision (due to measurements of hundreds of beads for each analyte). Only a few papers have reported the use of functional nanoparticles for multiplexed quantitative bioanalysis of penicillin [21, 22], but not for chloramphenicol.
In this report, we present a new detection format for the simultaneous determination of penicillin G and chloramphenicol based on the use of two corresponding immobilized antibodies on magnetic nanoparticles and conjugates from two analytes and two different fluorescent dyes. The magnetic properties of the MNPs allowed their manipulation by an external magnetic field without the need for centrifugation and filtration. The method developed here enables a direct, simple, and quantitative multiplex antibiotics analysis in raw milk.
2. MATERIALS AND METHODS
2.1. Reagents
Penicillin G sodium salt (Pen G), chloramphenicol succinate sodium salt (CAP), ATTO 633-amine, Fluorescein isothyocianate (FITC), 1-Ethyl-3-(3-dimethylaminopropyl) carbodiimide hydrochloride (EDAC), N-hydroxysuccinimide ester (NHS), Ovalbumin (OVA), bovine serum albumin (BSA), Sephadex G 25, dimethyl sulfoxide (DMSO), Bradford reagent, sodium carbonate, sodium hydrogen carbonate for the preparation of carbonate buffer, sodium phosphate dibasic heptahydrate, and sodium phosphate monobasic dehydrate for the preparation of Phosphate Buffer (PB) were purchased from Sigma. Anti-penicillin monoclonal antibody, anti-chloramphenicol monoclonal antibody, General Chloramphenicol (CAP) ELISA Kit for chloramphenicol, and Penicillin G (benzyl penicillin) ELISA Kit for penicillin G were purchased from MyBioSource, Inc, USA.
2.2. Instrumentation
UV/visible spectrophotometer Jenway 6900 was used for the fluorescent conjugate spectrum scanning after gel filtration, Fluorescent spectrophotometer Varian Cary Eclipse was used for the fluorescent immunoassay.
2.3. Preparation and Purification of Chloramphenicol-Ovalbumin and Chloramphenicol-Ovalbumin-FITC Conjugates
The preparation of Chloramphenicol-Ovalbumin-FITC conjugate was performed at two stages. At the first stage, Chloramphenicol-Ovalbumin (CAP-Protein) conjugate was obtained. CAP-Protein conjugate was synthesized by the activated ester method. 7 mg CAP succinate was dissolved in 0.5 mL distilled water. Then 6.35 mg 1-cyclohexyl-3-(2-morpholino-ethyl) carbodiimide metho-p-toluene sulphonate in 0.1 mL distilled water and 1.75 mg N-hydroxysuccinimide in 0.1 mL distilled water were added (pH 5.3). The reaction mixture was incubated with stirring for 1 h at room temperature. To 3 mg ovalbumin (OVA) in 0.2 mL 10 mM PB pH 7.4, 0.5 mL (10 mg/mL) of the activated CAP succinate was added. The reaction mixture was incubated with stirring for 2 h at room temperature followed by overnight incubation at 4°C. Subsequently, dialysis against distilled water was carried out for 5 days. The obtained CAP-Protein conjugate was labeled with FITC. 0.5 mL of the conjugate (3 mg/mL) was dialyzed against 50 mL of 50 mM carbonate buffer, pH 9 for 16 h at 4°C with slow stirring. FITC was dissolved in anhydrous DMSO at 1 mg/mL concentration. 1 μL of the dye was added to the dialysed protein (0.5 mL) every 30 min to get a final concentration of 100 ng FITC/1 μg protein. After all the dye solution was added, the mixture was incubated at 4°C for 12 h. On the next day, the conjugate was fractionated by gel filtration using Sephadex G 25 fine. The fractions containing the conjugate were concentrated by vacuum evaporation and lyophilized.
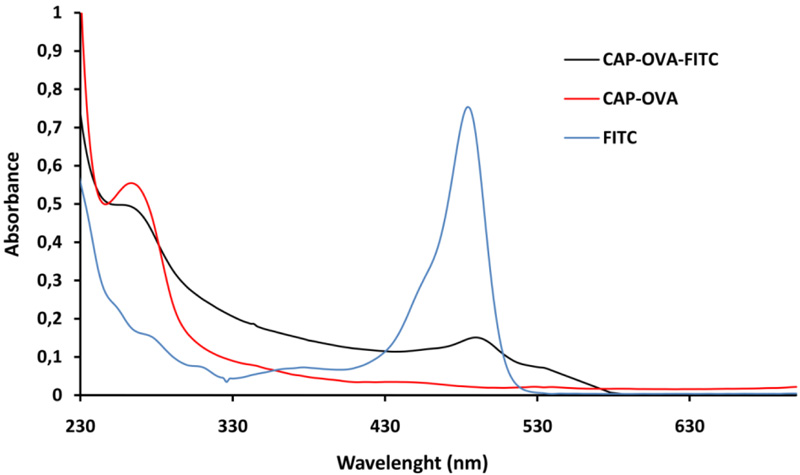
The absorption spectra of the obtained fluorescent conjugate (1 mg/mL) were compared to the absorption spectrum of chloramphenicol-ovalbumin (1 mg/mL) and FITC (0.1 mg/mL).
2.4. Preparation and Purification of Penicillin G – ATTO 633 Conjugate
ATTO 633-amine was used as a fluorescent marker for Penicillin G fluorescent labeling. The conjugate was prepared via the carbodiimide method. First, 10 mg 1-Ethyl-3-(3-dimethylaminopropyl) carbodiimide hydrochloride (EDAC) and 5 mg N-hydroxysuccinimide ester NHS were dissolved in 2 mL 0.01 M PB pH 6.8. After that, 20 mg of Penicillin G was added and the mixture was incubated for 2 hours at room temperature with orbital agitation. After that, 300 µl amine modified ATTO 633 (20 mg/mL in DMF) was added and the mixture was incubated at 4 °C overnight. On the next day, the conjugate was purified by gel filtration using Sephadex G 25 fine. The fractions containing the conjugate were concentrated by vacuum evaporation and lyophilized.
The absorption spectra of the obtained conjugate (1 mg/mL) were compared to the absorption spectrum of penicillin G (1 mg/mL) and ATTO 633 (0.1 mg/mL).
2.5. Immobilization of Antibody Onto MNPs
The preparation and functionalization of MNPs with (3-aminopropyl)triethoxysilane (APTES) were carried out by methods described in a few studies [26, 27]. Co-precipitation of Fe2+ and Fe3+ salts in water was performed followed by the functionalization of the magnetic nanoparticles. A Syrris Globe system (UK) was used for both processes. The uncoated and coated nanoparticles were compared by TEM (JEM-1400 PLUS, USA). 1 mL functionalized magnetic nanoparticles with concentration 5 mg/mL were collected by a magnet and then 1 mL glutaraldehyde solution (5% w/v in 50 mM PB, pH 8.0) was added. The mixture was left for incubation 2 h at room temperature with orbital agitation. The particles were washed five times with PB (pH 7.4) and resuspended in 1 mL of the same buffer. Then 10 µL (10 mg/mL) of the antibody was added to the magnetic nanoparticles and the covalent immobilization was carried for 2.5 h at 4°C. The derivatized antibody-magnetic particles were collected with a magnet and washed three times with 10 mM PB (pH 7.4) and resuspended in 1 mL of the same buffer. Then Ab-MNPs were incubated with 1 mL in 0.25M sodium cyanoborohydride in 10 mM PB pH 7.4. After 30 min at 37°C, the Ab-MNPs were washed three times with 3 mL of 10mM PBS pH 7.4. 3 mL of 10 mM PB (pH 7.4) with 5% bovine serum albumin and 0.05% Tween 20 was added to Ab-MNPs to block the free active groups of the MNPs and the mixture was gently stirred for 1 hour at room temperature. The Ab-MNPs were washed four times with 10 mM PB (pH 7.4) and resuspended in 1 mL of the same buffer to reach 5 mg/mL final concentration of the Ab-MNPs complex.
2.6. Determination of Immobilized Antibody amount on Magnetic Nanoparticles
The efficiency of the coupling strategies was evaluated by analyzing the antibody concentration in the supernatant before and after the coupling by the Bradford method [28]. The amount of antibody bound to the MNPs (mg Ab) was calculated according to the following equation:
mg Ab= mg Ab' -mg Ab”/mgMNPs
where mg Ab' is the amount of antibody (in mg) in the starting solution; mg Ab” is the amount of the unbound antibody (in mg) in the supernatant.
2.7. Optimization of Ab-MNPs amount and Fluorescent Conjugate Concentration for Fluorescent Immunoassay
Four different concentrations of the fluorescent conjugates (Chloramphenicol-Ovalbumin-FITC and Penicillin G – ATTO 633 conjugates) – 1, 3, 5, and 10 µg/mL were varied. All the conjugate concentrations were combined with four different amounts of the relevant antibody-MNPs (0.125, 0.25, 0.375, and 0.5 mg of Ab-MNPs). The immunoassays were carried in the absence of free antigen. Each amount of antibody-MNPs described above was put into a microcentrifuge tube. After that, 100 μl of PB, pH 6.6) was added. Then the relevant concentration of the conjugate described above was added to the samples. An incubation step was performed for 15 min at 37°C. The particles were collected with a magnet, the supernatant was taken out, and the residual fluorescent intensity was measured on Varian Cary Eclipse Fluorescent spectrophotometer. The fluorescence signal of the supernatant was measured at 494/518 nm for the chloramphenicol experiments and at 633/657 nm for the penicillin G experiments.
2.8. Calibration Curves of Penicillin G and Chloramphenicol in Buffer and in Raw Cow Milk
0.375 mg of the antibody – magnetic nanoparticles was used to plot the calibration curve for penicillin G in the buffer. 100 μl phosphate buffer pH 6.6 spiked with penicillin G from 0.5 to 50 ng/mL were added. The samples were incubated 15 min at 37°C. Then 100 µl of the fluorescent conjugate (5 µg/mL) was added to each sample and incubation step was performed for 15 min at 37°C. After that, the particles were collected with a magnet, and the residual fluorescent intensity of the supernatant was measured at 633/657 nm. 0.25 mg of the antibody – magnetic nanoparticles was used to plot the calibration curve for chloramphenicol in the buffer. 100 μL phosphate buffer pH 6.6 spiked with chloramphenicol from 0.01 to 50 ng/mL were added. The samples were incubated 15 min at 37°C. Then 100 µL of the fluorescent conjugate (5 µg/mL) was added to each sample and incubation step was performed for 15 min at 37°C. After that, the particles were collected with a magnet, and the residual fluorescent intensity of the supernatant was measured at 494/518 nm.
Experimental signals were calculated by the equation:
Normalized response = [(BO – B)/(BO – Bx)].100,%,
where B is the signal (intensity of fluorescence) measured in the presence of the increasing analyte concentrations; Bx is the signal in absence of analyte; and Bo is the signal of the initial conjugate solution.
Likewise, the calibration curves for Pen G and chloramphenicol in raw cow milk diluted 4:1 with water were also plotted.
2.9. Simultaneous Determination of Penicillin G and Chloramphenicol in Raw Cow Milk
0.375 mg of the penicillin G antibody – magnetic nanoparticles and 0.25 mg of the chloramphenicol antibody – magnetic nanoparticles were used for the simultaneous determination of Penicillin G and Chloramphenicol. Raw cow milk diluted with water 4:1 was spiked with different concentrations of the antibiotics from the linear range. 100 μL of the spiked milk was added to the antibody – magnetic nanoparticles. The samples were incubated 15 min at 37°C. Then 100 µL of each fluorescent conjugate (10 µg/mL) was added to the samples and incubation step was performed for 15 min at 37°C. After that, the particles were collected with a magnet, and the residual fluorescent intensity of the supernatant was measured at 633/657 nm and 494/518 nm.
3. RESULTS AND DISCUSSION
3.1. Preparation and Purification of Chloramphenicol-Ovalbumin-FITC Conjugate and Penicillin G – ATTO 633 Conjugate
The preparation of Chloramphenicol-Ovalbumin-FITC conjugate was performed at two stages. At the first stage, Chloramphenicol-Ovalbumin (CAP-OVA) conjugate was obtained. CAP-OVA conjugate was synthesized by the activated ester method. The obtained CAP-OVA conjugate was labeled with FITC and purified by gel chromatography method. Then the CAP-OVA-FITC conjugate was characterized by its absorption spectrum. The absorption spectrum of CAP-OVA-FITC conjugate is compared with the absorption spectra of FITC and CAP-OVA conjugate (Fig. 1).
The spectrum of CAP-OVA and CAP-OVA-FITC shows the protein characteristic peak around 280 nm, characteristic for proteins. When the spectrum of the obtained fluorescent conjugate is compared to the initial fluorescent dye spectrum it is obvious that the peak is at the same place around 492 nm. The presence of a protein and FITC peaks in the conjugate spectrum clearly demonstrates the formation of the fluorescent conjugate.
The Pen G-ATTO 633 conjugate was prepared via the carbodiimide method, as the ATTO 633 amine derivative was used. The first step in obtaining the Pen G-ATTO 633 conjugate is to activate the Pen G by the carbodiimide method, which is one of the most commonly used conjugation methods. The carbodiimide first reacts with the carboxyl group of Pen G to form the highly reactive O-acylisocarbamide as an intermediate. The activated carboxyl group then reacted with the primary amino group of the fluorescent dye ATTO 633. An amide bond is formed in the reaction and a soluble isocarbamide derivative is separated as a by-product. After the purification by gel chromatography, the fraction containing the conjugate was analyzed using a UV-Vis spectrophotometer. The resulting spectrum is shown on (Fig. 2). The absorption spectrum of Pen G-ATTO 633 conjugate is compared with the absorption spectra of ATTO 633 and Pen G (Fig. 2).
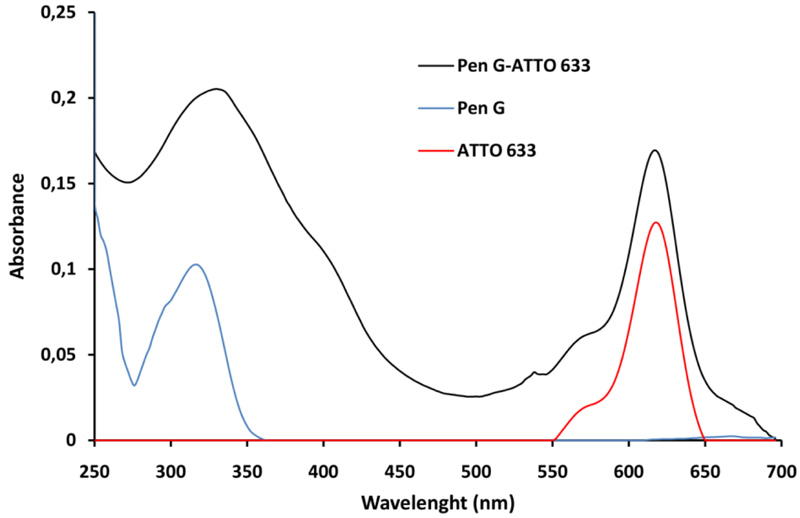
The formation of Pen G-ATTO 633 conjugate is proved by the presence of characteristic peaks of Pen G and ATTO 633 in the absorption spectrum of the fluorescent conjugate. It is obvious that the Pen G characteristic peak is slightly moved from 320 to 330 nm in the fluorescent conjugate spectrum, while the peak of ATTO 633 is at the same place.
3.2. Optimization of Ab-MNPs and Fluorescent Conjugate Concentration for Fluorescent Immunoassay
The competitive immunofluorescent assay was developed. For this purpose, three essential elements are needed – immobilized antibody, fluorescent conjugate, and analyte. Two kinds of antibody – anti-penicillin and anti-chloramphenicol antibodies were immobilized on modified MNPs. Nanoparticles were obtained in our laboratory using a chemical reactor (from Syrris Company). After that, APTES modification was performed for the formation of amino groups onto MNPs surface. The modified MNPs had an average diameter of 8.2 nm, confirmed by transmission electron microscopy (JEM-1400 PLUS). The antibody immobilization was performed by glutaraldehyde activation. The efficiency of the coupling strategies was evaluated by analyzing the antibody concentration in the supernatant before and after the coupling, by the Bradford method [28]. For the penicillin G antibody, it was determined that for each mg magnetic nanoparticles 22.3 µg antibody was immobilized. This amount for the chloramphenicol antibody was 24 µg. The immobilizing efficiency depends on the size of MNPs. The smaller the size of the MNPs provides the greater the specific surface for antibody immobilization. In our case, the size diameter of the initial MNPs was 6.5 nm and the diameter of functionalized MNPs was 8.2 nm [27] and the immobilization capacity was high.
The second important element for immunoassay is fluorescent conjugates which were used as a tracer in a fluorescent immunoassay for the determination of penicillin G and chloramphenicol. It is very important for an immunoassay to determine the optimal concentrations of immobilized antibody and fluorescent conjugate. Four different concentrations of the conjugates and four different amounts of the antibody were varied. The conjugate concentrations were – 1, 2, 5, and 10µg/mL in PB pH 6.6. For each conjugate concentration, the amount of Ab-MNPs was varied - 0.125, 0.25, 0.375, and 0.5 mg. The immunoreaction was carried between antibody and fluorescent conjugate, without analyte. Fluorescent intensity of unbound conjugate in the supernatant was measured on Varian Cary Eclipse Fluorescent spectrophotometer at 494/518 nm for the chloramphenicol experiments and at 633/657 nm for the penicillin experiments.
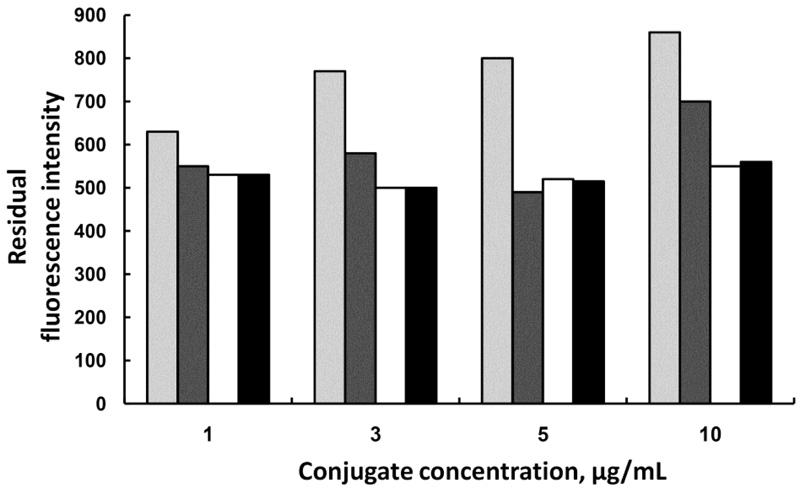
Optimization of the anti-Pen G Ab-MNPs amount and Pen G-ATTO 633 fluorescent conjugate concentration is presented on (Fig. 3). It was found, that the best result was obtained at 5µg/mL conjugate concentration and 0.375 mg Ab-MNPs amount (immobilized antibody on MNPs). At this combination, the fluorescence intensity of unbound conjugate is the lowest. At the highest conjugate concentration (10 μg/mL), the immunoreactions were hindered and the fluorescent intensity of unbound conjugate was too high so this reflects on the precision determining of the bound conjugate. At the lowest conjugate concentration (1μg/mL), probably all the conjugate was bound to the immobilized antibody so different amounts of antibody did not influence.
The same effect was observed when the optimization was performed for chloramphenicol conjugate, but there the optimal amount of Ab-MNPs was found to be 0.25 mg and the optimal concentration of the fluorescent conjugate was 5µg/mL (Fig. 4).
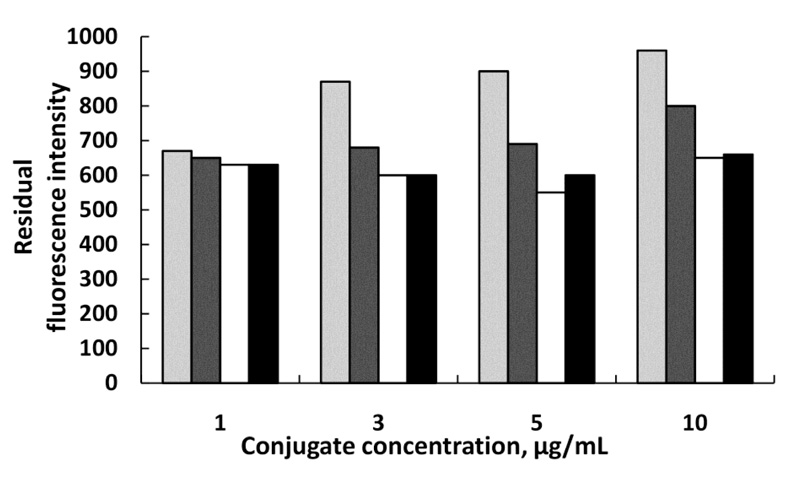
 0.125 mg,
 0.25 mg,
 0.375 mg and
 0.5 mg Ab-MNPs.
 0.125 mg,
0.25 mg,
0.375 mg, and
0.5 mg Ab-MNPs.
0.125 mg,
0.25 mg,
0.375 mg, and
0.5 mg Ab-MNPs.
3.3. Calibration Curves of Single Analysis of Penicillin G and Chloramphenicol in Buffer and in Raw Cow Milk
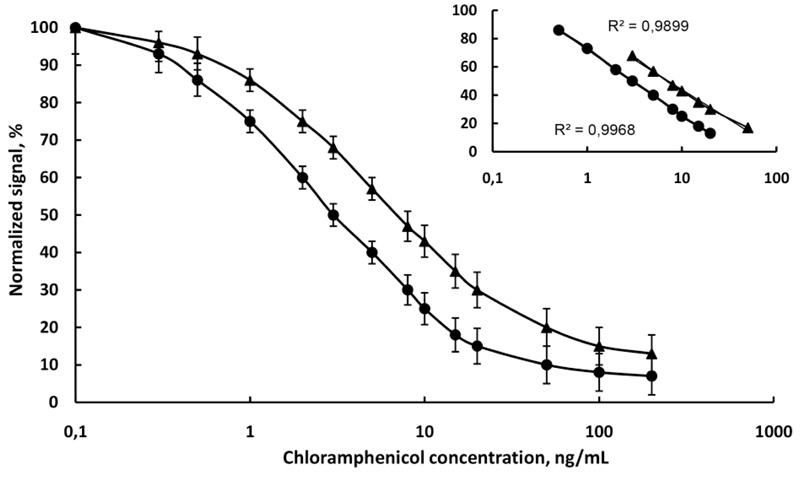
First, the competitive immunofluorescence method was developed with a single analyte in the buffer to evaluate its sensitivity and repeatability. The competitive immunofluorescence method was then applied to raw cow milk diluted with water 4:1. Fig. (5) shows the calibration curve of immunofluorescence determination of chloramphenicol in PB, pH 6.6 and milk. The linear range is from 0.5 to 20 ng/mL and from 1 to 50 ng/mL in buffer and milk, respectively. The detection limit of chloramphenicol is 0.4 ng/mL in the buffer and 0.6 ng/mL in milk. In compliance with the IUPAC rules (Orange Book) [29], the limit of detection was calculated as three times the standard deviation of the blank measurements. The linear equivalents and correlation coefficients (R2) are presented in (Fig. 5). It is obvious that the sensitivity of chloramphenicol immunoassay in the buffer (slope -20.17) was higher than the sensitivity of chloramphenicol immunoassay in milk (slope -17.94). The R2 values were close to the unit (0.9968 in buffer and 0.9899 in milk), which suggests a good fit of experimental data to the calibration curve. The standard deviations of the slopes (R.S.D.%) in all cases were minor than 6%, indicating an acceptable variability.
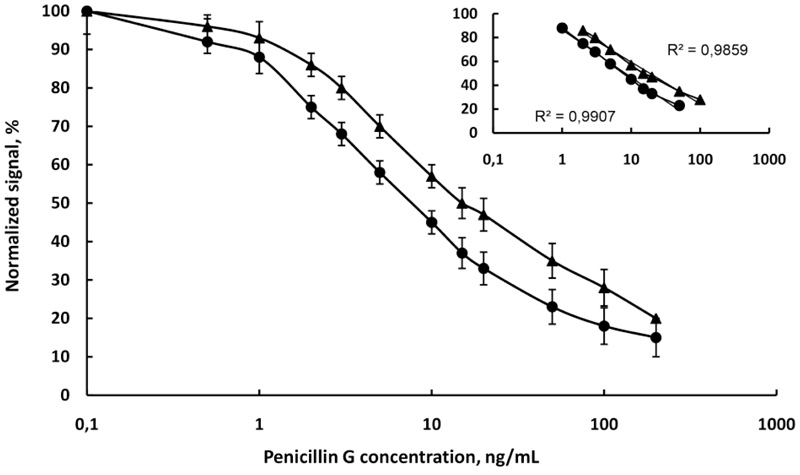
(Fig. 6) showed the calibration curves of penicillin G in PB, pH 6.6 and raw milk diluted with water 4:1. The linear range is from 1 to 50 ng/mL and from 2 to 100 ng/mL in buffer and milk, respectively. The detection limit is 0.8 ng/mL in the buffer and 1.4 ng/mL in milk. From (Fig. 6) it is evident that the slope of the linear range of curve in the buffer (-17.29) was better than the slope in milk (-15.25), due to the matrix effect of milk. The correlation coefficients (R2) were high 0.9907 in buffer and 0.9859 in milk. The standard deviations of the slopes (R.S.D.%) in these cases were the same as the chloramphenicol curves.
It was found that the matrix influence of milk was weak. The obtained LOD of chloramphenicol in milk was lower than the LOD of penicillin in milk. On the other hand, the obtained LOD for investigated antibodies was lower than MRLs for each antibiotic in milk. Obviously, the fluorescence intensity detected by antibiotic samples in raw milk is still strong and sufficient to detect the lowest allowable amount of antibiotics in milk at the MRLs level. Usually, in other papers, the matrix effects in the milk samples were easily eliminated by centrifugation [7, 18, 19]. In our case, the dilution of milk in ratio milk: dH2O = 4:1 provided good elimination of matrix effects, because the MNPs carried the specific isolation of multiple target analytes from the sample.
The obtained LOD of penicillin and chloramphenicol in raw milk was very close to the analogical ELISA results from other authors, (Table 1).
 and in raw cow milk
 , N=6.
 and in raw cow milk
, N=6.
and in raw cow milk
, N=6.
The comparison shown in Table 1 is with results obtained from other authors by the most similar method - ELISA. Chromatographic methods (HPLC and GC) and microbiological methods are also widely used to determine residual antibiotic concentrations [31] since antibiotics are growth inhibitors of microorganisms. The LOD of the chromatographic methods is identical (1 ng /mL for penicillin and 4 ng/mL for chloramphenicol) [32]. For microbiological methods, the LOD of penicillin G was 3 ng/mL, while the detection of chloramphenicol by this method was not possible [31]. However, microbiological methods are time-consuming and require sample pre-treatment and well-trained specialists.
The LOD value in another study [18] is very low because they used sensitive biotin−streptavidin amplified enzyme-linked immunosorbent assay for the determination of chloramphenicol residues in milk. The detection limit of the method was found to be 0.042 ± 0.006 ng/mL, which is 8-fold more sensitive than the traditional competitive ELISA using the same antibody and coating antigen. In our previous paper [25], we used an anti-penicillin polyclonal antibody and received LOD for penicillin in milk - 3 ng/mL. Now we obtained lower LOD for penicillin G because we used MNPs that are 2 times smaller in size and monoclonal anti-penicillin antibody.
3.4. Simultaneous Determination of Penicillin G and Chloramphenicol in Raw Cow Milk
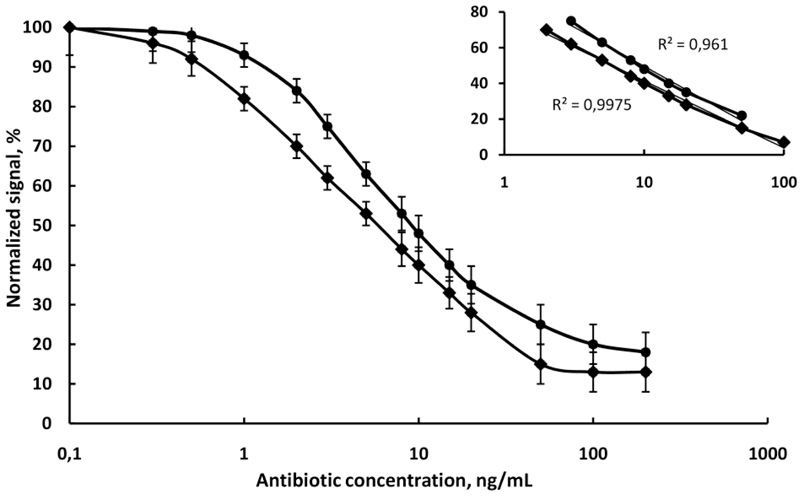
Simultaneous detection of two antibiotics in the same milk sample was performed. The relevant amounts of magnetic nanoparticles with separately immobilized antibodies were put in the diluted milk sample. The two antibiotics in the sample bound to the corresponding antibodies. Then the fluorescent conjugates were added and they bound to the rest free active site of the corresponding antibodies. The fluorescent intensity of unbound conjugates in the supernatant was measured on Varian Cary Eclipse Fluorescent spectrophotometer at 494/518 nm for the chloramphenicol and at 633/657 nm for the penicillin. Each dye was individually excited at a specific wavelength, thus avoiding the need for deconvolution. Fluorescence read-out is performed in seconds resulting in a very short analysis time. The calibration graph for the multiplexed fluoroimmunoassay is presented in (Fig. 6). It can be observed that the multiplexed standard curves are very similar to those for the corresponding single analyte assays in raw milk. A negative control experiment showed negligible nonspecific interactions.
 and chloramphenicol
 in raw cow milk, N=6.
The assay sensitivity is usually expressed in terms of its lower LOD and slope of the curve. The highest sensitivity was obtained for chloramphenicol with a limit of detection (LOD) of 0.85 ng/mL, followed by penicillin G with LOD of 1.6 ng/mL. The linear equivalents and correlation coefficients (R2) are presented in (Fig. 7). It is obvious that the sensitivity of chloramphenicol immunoassay in raw cow milk (slope -17.51) was higher than the sensitivity of penicillin immunoassay in the same sample (slope -15.13). The R2 values were high (0.9975 for chloramphenicol and 0.961 for penicillin), which suggests a good fit of experimental data to the calibration curve. The standard deviations of the slopes (R.S.D.%) in all cases were minor than 7.5%, indicating an acceptable variability. It was found that the anti-penicillin monoclonal antibody had no cross-reactivity with chloramphenicol and anti-chloramphenicol monoclonal antibody had no cross-reactivity with penicillin.
The same experiments were performed with a microtiter plate, without MNPs. It was found that the heterogeneous fluorescent immunoassay was not possible on the surface of a microtiter plate because very weak fluorescence was detected. In the proposed new detection format for simultaneous determination of penicillin G and chloramphenicol on the base of immobilized antibodies on MNPs, many MNPs are interrogated and the signal obtained is statistically representative, resulting in better precision [22]. It is obvious that the signal amplification of the reporter was observed due to the large surface of the MNPs for one microcentrifuge tube.
The recovery of penicillin G and chloramphenicol was determined simultaneously in raw cow milk spiked with antibiotics with concentrations from the linear range of each calibration curve. The recovery is presented in Table 2. Some samples showed variation from the line of identity between the added and the recovered antibiotic concentrations. Recovery determinations of antibiotic concentrations near the middle of the calibration curve provided the most precise results. The calculated percents for recovery were between 98-106%.
| Added, ng/mL | Recovered, ng/mL | Recovery, % | |||
|---|---|---|---|---|---|
| Chloramphenicol | Penicillin G | Chloramphenicol | Penicillin G | Chloramphenicol | Penicillin G |
| 1 | 2 | 1.04 | 1.98 | 104.00 | 99.00 |
| 5 | 10 | 5.10 | 10.12 | 102.00 | 101.20 |
| 10 | 30 | 9.94 | 31.00 | 99.40 | 103.30 |
| 30 | 80 | 31.50 | 82.00 | 105.00 | 102.50 |
CONCLUSION
A new platform for a multiplexed immunoassay for the determination of low concentrations of antibiotics on the base of magnetic nanoparticles was developed. The application of MNPs in immunoassay provides the specific extraction of multiple target analytes from a sample and rapid, high sensitive immunoassay due to their large specific surface and the ability to apply magnetic separation.
ETHICS APPROVAL AND CONSENT TO PARTICIPATE
Not applicable.
HUMAN AND ANIMAL RIGHTS
No animals/humans were used for studies that are the basis of this research.
CONSENT FOR PUBLICATION
Not applicable.
AVAILABILITY OF DATA AND MATERIAL
Not applicable.
FUNDING
The authors thank the Bulgarian National Science Fund at the Ministry of Education for the financial support within the framework of the Bulgarian-Russian project 02/10-2018 and the Russian Foundation for Basic Research (bilateral project 18-53-18013).
CONFLICT OF INTEREST
The author declares no conflict of interest, financial or otherwise.
ACKNOWLEDGEMENTS
Declared none.