All published articles of this journal are available on ScienceDirect.
Evaluation of Pb (II) Adsorption from Aqueous Solutions Using Brassica nigra as a Biosorbent
Abstract
Objectives:
The Pb non-biodegradability results in bioaccumulation in living organisms causing serious health disorders. The present study aimed to investigate the capacity of Pb (II) adsorption in aqueous solutions using the Brassica nigra species as biosorbent.
Methods:
The present study was conducted using a synthetic solution with three Pb (II) concentrations (5, 15, and 30 ppm). The B. nigra was suitably treated until it became dry particles. After sifting it, three ranges of grain sizes were obtained. Samples of dry particles were analyzed before and after the biosorption to analyze their topography (SEM), as well as the elements on their surface (EDS). The influence of different operating variables on the biosorption of Pb (II) were analyzed. Kinetics of Pb (II) biosorption was analyzed with pseudo first and second order models. The biosorption in the equilibrium was studied with the Langmuir isotherm and Freundlich isotherm models.
Results:
The biosorbent B. nigra showed to be efficient for the adsorption of Pb (II). The most influential variables in the adsorption were pH, particle size, and biosorbent/solution ratio. The optimum pH for the adsorption of lead was 5 and removed 82.10% of lead from solution at 5 ppm, 82.24% at 15 ppm and 57.95% at 30 ppm. The results for the particle size between 177 and 297 μm were 82.65% for 5 ppm, 73.71% for 15 ppm, and 53.54% for 30 ppm. The biosorbent/solution ratio of 0.6 mg/mL or the 30 mg dose of biosorbent removed 80.26% for 5 ppm, 79.32% for 15 ppm, and 59.87% for 30 ppm. Biosorption isothermal data could be well interpreted by the Langmuir model with a maximum adsorption capacity of 53.476 mg/g of lead ion on B. nigra stem and roots biomass. The kinetic experimental data was properly correlated with the second-order kinetic model (R2 = 0.9997). Thus, the best desorbing agent was HNO3 (0.1N) for Pb (II) desorption.
Conclusion:
Our study showed that the herb B. nigra, without any chemical treatment, can be used to remove heavy metals such as Pb (II) from water and aqueous solution.
1. INTRODUCTION
Air, water, life, and technology are strongly interconnected [1, 2]. Technology refers to the ways in which humans do and make things with materials and energy. Over 97% of Earth’s water is found in oceans, and most of the remaining fresh water is found in the form of ice [1, 3, 4]. Therefore, only a relatively small percentage of the total water on Earth is actually involved with terrestrial, atmospheric, and biological processes [1, 5]. Modern civilization depends upon a wide variety of resources largely consisting of minerals that are processed to recover the materials needed for industrial activities [1]. Heavy metals have a density greater than 3 gcm‒3 [6] and they release toxic pollutants as a result of different activities such as industries, mining, and agriculture [7]. Lead is a heavy, low melting, bluish-gray metal that naturally occurs in the Earth's crust [8, 9]. However, it is rarely found naturally as a metal. It is usually found combined with two or more other elements to form lead compounds [8]. Lead occurs naturally in the environment. However, most of the high levels found through- out the environment come from human activities [8, 10, 11]. Lead can enter the environment through release from mining lead [8, 12, 13], and other metals, and from factories that make or use lead, lead alloys, or lead compounds. Small amounts of lead may enter rivers, lakes, and streams when soil particles are moved by rainwater [8]. Movement of lead from soil particles into groundwater is unlikely unless the rain falling on the soil is acidic or “soft”. Movement of lead from soil will also depend on the type of lead compound and on the physical and chemical characteristics of the soil [8]. The non-biodegrad- ability of Pb results in its bioaccumulation in living organisms causing serious health disorders [14-16]. Lead is known to be toxic to plants, animals, and microorganisms [17] whose widespread use has caused extensive environmental contami- nation and health problems in many parts of the world [18]. Lead poisoning accounts for 0.6% of the global burden of disease [19] which can be either acute or chronic [20]. Acute exposure can cause loss of appetite, headache, hypertension, abdominal pain, renal dysfunction, fatigue, sleeplessness, arthritis, hallucinations, and vertigo. Acute exposure mainly occurs in the workplace and in some manufacturing industries which make use of lead [20] Lead has major effects on different parts of the body. Lead distribution in the body initially depends on the blood flow into various tissues and almost 95% of lead is deposited in the form of insoluble phosphate in skeletal bones [21]. Chronic exposure to lead can result in mental retardation, birth defects, psychosis, autism, allergies, dyslexia, weight loss, hyperactivity, paralysis, muscular weakness, brain damage, kidney damage, and may even cause death [20]. According to the Environmental Protection Agency (EPA), lead is considered a carcinogen [8, 20-22]. Inorganic lead arising from a number of industrial and mining sources occurs in water in the +2-oxidation state [1]. Inorganic lead compounds are hazardous because the metabolism of lead is very similar to that of calcium [23]. Lead metal ions replace other bivalent cations like Ca2+ [18, 24], and lead inhibits many enzymes [23-25]. The Pb2+ ion is a broad-spectrum poison [23]. Lead from leaded gasoline used to be a major source of atmospheric and terrestrial lead, much of which eventually entered natural water systems. In addition to pollutant sources, lead‒bearing limestone and galena (PbS) contribute lead to natural waters in some locations [1] There is a wide variety of processes to remove contaminants from water and wastewater. Biosorption has emerged as a potential and promising solution to remove toxic heavy metals from water and wastewater [26]. Biosorption is the property exhibited by inactive, non-living substances of biological origin to bind and to accumulate metal ions from aqueous solution [27]. One of the mechanisms often involved in heavy metals adsorption on biomaterials is the ion exchange mechanism [28, 29]. The biosorption is a complex phenomenon that can involve different processes such as complexation, coordination, electro- static attraction or microprecipitation [30]. The biosorbents are characterized by being friendly to the environment and by having abundant biological materials [28, 31]. Diverse waste materials have been used as low-cost biosorbents for heavy metals from water solutions [31] such as lead, etc [16, 26, 32-34]. One of the main advantages of using biomass as a biosorbent is the easy treatment of this waste after its use by incineration, for example, in cement plants for energy recovery [28]. The Brassicaceae family comprises approximately 350 genera and 3000 species, distributed throughout the world but mainly in temperate regions. In Peru, 27 genera and 104 species are generated of which 2 genera and 28 species are endemic [35]. The genus Brassica consists of 150 species of annuals or biennial herbs, several of which are cultivated as oilseed crops or as vegetables or as fodder. Three varieties are in popular use - Brassica alba, Brassica juncea, and Brassica nigra. B. nigra is an annual herbaceous plant which grows to a height of about 1 meter [36]. It is native to northern Africa, western and central Asia, and parts of Europe [37]. The objective of this study was to evaluate the capacity of Pb (II) adsorption in aqueous solutions using the B. nigra species as biosorbent, by optimizing physicochemical parameters, as well as the parameters of adsorption kinetics. Adsorption kinetic models were studied with pseudo-first order and pseudo second-order models. The equilibrium isotherms were analyzed by the Langmuir and the Freundlich models.
2. MATERIALS AND METHODS
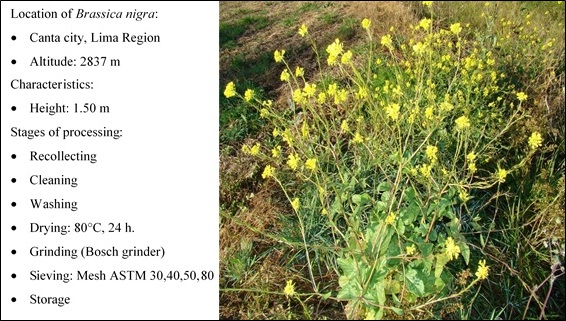
The following flow diagram (Fig. 1) shows the stages that were applied for the treatment of B. nigra (stems and roots) to obtain it as a biosorbent material.
2.1. Topographic Characterization of the Brassica Nigra Species
To perform a topography and metal analysis on the surface of the biosorbent, a sample was dried in an oven at 105°C for 5 hours until obtaining a constant mass sample equal to 7.0141 grams. To determine the functional groups present in the cell wall of the biosorbent B. nigra responsible for the removal of Pb (II), a Shimadzu FT-IR spectrometer, model IR - prestige - 21, was used. This technique reflects the characteristic vibrations of the groups of atoms and is used to especially identify the organic groups and thus to know the chemical structure of the biosorbent before and after the process of adsorption of Pb (II). The topography of biosorbent was analyzed with a Scanning Electron Microscopy (SEM, HITACHI, model SU8230), and a semi-quantitative determi- nation of the elements present on the surface of the initial biosorbent was performed by Energy - Dispersive X-ray Spectroscopy (EDS), an analysis technique that is incorporated in the SEM.
2.2. Preparation of the Synthetic Solution
Pb (II) solutions were prepared from the salt Pb (NO3)2 (Sigma Aldrich) with concentrations of 5, 15, and 30 mg/L. To conserve these solutions, they were kept at a pH less than or equal to 2 by adding drops of concentrated nitric acid at 63% by weight.
2.3. Pb (II) Biosorption Test
A sample of 50 mL of the stock solution was fixed to pH with HNO3 and/or NaOH (both 0.1N, Sigma Aldrich). The sample with known pH was placed in a conical 50 mL test tube and the biosorbent was added. After a while, the sample was centrifuged (GEMMY PLC‒012E) for 10 minutes. An aliquot of the supernatant solution was analyzed in a Perkin Elmer Analyst 200 Atomic Absorption Spectrophotometer. In this way, the initial and final concentration of Pb (II) were both determined after the biosorption.
2.4. Determination of Adsorption Capacity
The amount of metal adsorbed by the biosorbent can be calculated as the adsorption capacity (Q, mg/g) [38-40]. This capacity depends on some variables such as pH, acid-base constants of the solution, among others.
 |
(1) |
Where V(L) is the volume of aqueous Pb (NO3)2 solution, Co (mg/L) and Cf (mg/L) are the concentration of initial and final Pb (NO3)2, respectively, and W(g) is the weight of the biosorbent.
2.5. Influence of Operational Variables on the Pb (II) Biosorption
To evaluate the adsorption capacity of the B. nigra species as a biosorbent, several operating parameters were considered. The pH varied between 2 and 5. The particle size and the biosorbent/solution ratio were all at room temperature. From the stock solution of 5, 15, and 30 Pb (NO3)2 mg/L, 4 samples of 50 mL each were prepared with pH of 2, 3, 4, and 5. To each solution, 30 mg of the biosorbent was added with a grain size that varied from 177 to 297 µm. They were shaken for 2 hours at 200 rpm at 25°C, subsequently centrifuged at 4000 rpm for 10 minutes, and the supernatants were recovered. An aliquot of each supernatant solution was taken in order to determine the lead remaining in the solution. The experiments were perfor- med in duplicate.
2.6. Effect of the Granulometry on the Biosorption of Pb (II)
To determine if the particle size of the biomass influences the removal of the heavy metal, the biomass was sieved with meshes according to Standard Specification for Woven Wire Test Sieve Cloth and Test Sieves (ASTM E11-17) [41] (Table 1). The number of meshes were 30, 40, 50 and 80 number meshes.
Table 1.
| Mesh Number (ASTM E11‒17) | Diameter of the Opening (microns) |
|---|---|
| 40 < x < 30 | 400 < x < 595 |
| 50 < x < 40 | 297 < x < 400 |
| 80 < x < 50 | 177 < x < 297 |
2.7. Effect of the Biosorbent/Solution Ratio on the Biosorption of Pb (II)
According to the experiments (see 2.5), the optimal pH for the biosorption was 5. The experiments were repeated at this pH in order to know the level of biosorption of B. nigra. For each concentration, three samples of 50 mL with the stock solution were fixed to pH 5, and 10, 30 and 50 mg of dry biomass were added, and the ratios were 0.2, 0.6, and 1 mg biosorbent/mL solution. The experiments were performed in duplicate, following the procedure described in section 2.5.
2.8. Kinetics of Pb (II) Biosorption
To evaluate the kinetics of the adsorption of Pb (II) on the B. nigra species, the necessary contact time was evaluated until the concentration of Pb (II) remained constant. For each concentration of 5 and 30 mg/L, 14 samples of 50 mL were prepared with the solution of Pb (NO3)2 at pH 5. To each solution, 30 mg of dry biomass was added with a grain size between 177 and 297 microns and left under constant stirring for 10 hours at a speed of 200 rpm at room temperature (25°C). For the analysis of Pb (II), in both cases, aliquots were taken from the solutions at 5, 10, 20, 30, 45, 60, 90, 120, 240, 292, 446, 480, 500, and 600 minutes. The kinetic models of pseudo first (Eq. 2) and second order (Eq. 3) were linearized and evaluated as follows [42-45]:
 |
(2) |
Where Qe (mg/L) denotes the amount of Pb (II) adsorbed at equilibrium, Qt (mg/L) is the amount of Pb (II) adsorbed at time t (min), and k1 (mg/g.min) is the pseudo-first order adsorption rate constant. The plots of Ln (Qe ‒ Qt) versus t give the value of k1 (mg/g.min) and Qe.
 |
(3) |
Where k2 (L/mg.min) is the pseudo second-order adsorption rate constant, and k2, Qe (mg/L) can be obtained from the intercept and slope of the plot of t/Qtversus t. The percentage of removal was evaluated as follows:
 |
(4) |
The initial rate of adsorption at t = 0 [45] was evaluated with Eq. (5), where h (mg/g.min):
 |
(5) |
The information on adsorption equilibrium is one of the vital factors required for proper analysis and design of the adsorbent-adsorbate system [47, 48]. The biosorption in the equilibrium was studied with the models of the Langmuir isotherm (Eq. 6) and the Freundlich isotherm (Eq. 7). The Langmuir model supposes that there is no interaction between the adsorbate molecules, and the adsorbate is distributed in a monolayer within the adsorbent [44, 49, 50]. The Freundlich isotherm model is an empirical equation describing the heterogeneous adsorption, and it assumes that different sites with several adsorption energies are involved [44, 51, 52]. The linearized models are as follows:
 |
(6) |
Where Ce (mg/L) is the equilibrium concentration of the adsorbate, Qe (mg/g) the amount of adsorbate adsorbed under equilibrium, kL (L/mg) the Langmuir adsorption constant, and Qmax the maximum adsorption amount. Qmax and kL are determined from the slope of the plot.
 |
(7) |
Where Qe is the amount of Pb (II) adsorbed at equilibrium (mg/g); Ce is the equilibrium concentration of the Pb (II); kF and ‘n’ are Freundlich constants; ‘n’ gives an indication of how favorable the adsorption process is; and kF (mg/g(L/mg)1/n) is the adsorption capacity of the adsorbent (B. nigra). The adsorption process is favorable when the values of ‘n’ are in the range of 2‒10, 1‒2 means moderately difficult, and less than 1 means poor level of adsorption [53, 54]. The intercept and the slope of the linear plot of Ln (Qe) versus Ln (Ce), give the values of kF and 1/n.
A measure to know if the Langmuir isotherm obtained is favorable or not, is through the separation factor or equilibrium parameter RL [55, 56], which is a dimensionless constant evaluated as follows:
 |
(8) |
Where, KL (L/mg) is the Langmuir constant; Co (mg/L), is the initial concentration of the adsorbate. The value of RL indicates whether the nature of the adsorption is favorable or unfavorable: If RL > 1, unfavorable; RL = 1, Linear; 0 < RL <1, favorable and RL = 0, Irreversible.
3. RESULTS AND DISCUSSION
3.1. Fourier Transform Infrared Spectroscopy
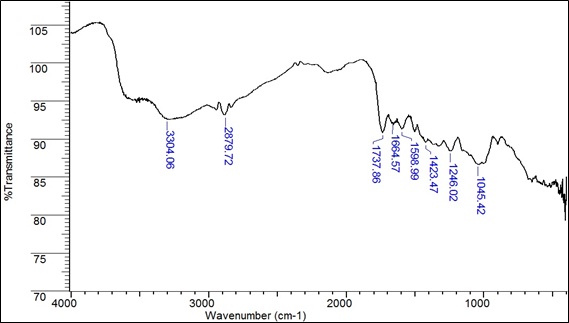
All the chemicals used in this study were chemicals of recognized analytical grade and were purchased from Sigma – Aldrich (Germany). Fig. (2) shows the main functional groups that are part of the structure of the biosorbent (B. nigra). Table 2 shows the main functional groups, wavenumber and intensity of the vibration related to Fig. (2). The values of the wavenumber were taken from George Socrates’s research. [57].
These functional groups can form coordination bonds with heavy metal ions [58, 59] through a donation of electron pairs thus forming complex [58, 50]. Fig. (3) shows the infrared spectrum of the biomass after Pb (II) adsorption at 30 mg/L for 2 hours at a constant speed of 200 rpm.
| Wavenumber (cm‒1) | Intensity | Functional Group | Group Name |
|---|---|---|---|
| 3304.06 | Medium | ‒OH | Hydroxyl/Phenol |
| 2879.72 | Strong | C‒H | Alkane |
| 1737.86 | Strong | C=O | Carboxylic acid |
| 1664.57 | Strong | N‒C=O | Amide |
| 1598.99 | Strong | C‒N | Amide 1° bending vibration |
| 1423.47 | Medium | C‒O‒H | Carboxylic acid bending |
| 1246.02 | Medium | C‒O‒C | Ether |
| 1045.42 | Medium | CO‒O‒CO | Anhydride |
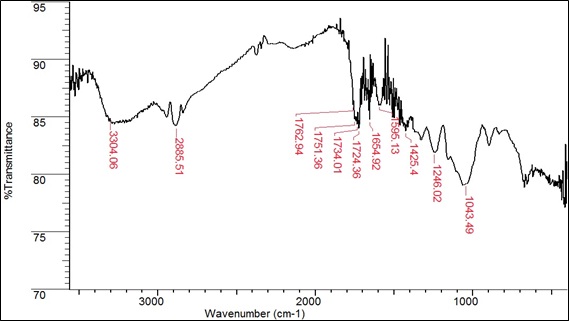
Table 3 summarizes the changes in wavenumbers (cm‒1) of each functional group after Pb (II) adsorption. The carboxylic group (‒COOH) shifted significantly from 1737.86 to 1762.92, 1751.36, 1734.01, and 1724.36 after treatment with Pb (II). These shifts in wave number correspond to a change in the binding energy corresponding to the functional group. This result confirmed the involvement of carboxylic acid groups in the binding of Pb (II) in the case of B. nigra [61, 62].
3.2. Scanning Electron Microscopy (SEM) and Energy Dispersive X-Ray Spectrometry (EDS)
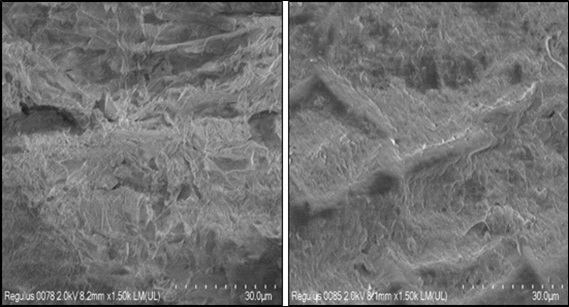
On the left, Fig. (4) shows pore distribution with diameters smaller than 3 μm before biosorption, more porous structure and “acicular” type growth. A very rough surface is observed. On the right after biosorption, a smoother surface is observed. Everything seems to indicate that the acicular porosity and growth happens to form a continuous surface. This could be due to the response of the biosorbent to the favorable absorp- tion of Pb (Fig. 4).
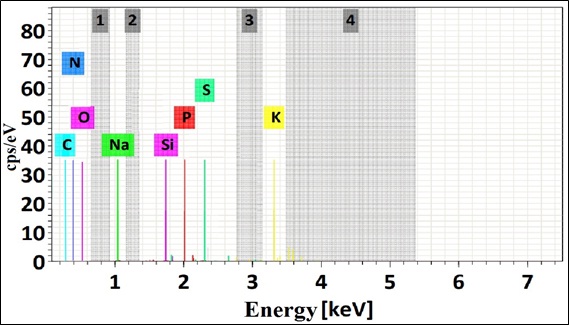
EDS analyzes elemental peak and composition including the presence of metal ions and no metals on the biomass of B. nigra before and after biosorption. EDS uses the accelerating voltage to detect these metal ions. Fig. (5) shows the first EDS spectrum before biosorption. The cell wall is rich in C, O, and N. It also summarizes the percentage of metals and no metals in the biosorbent in (Table 4). This table corresponds to the first EDS spectrum. After biosorption, a different peak was detected in the accelerating voltage axis. The analyses in Fig. (6) revealed that lead was part of the cell wall of the biosorbent. In addition, the percentage of lead in the biomass is shown in Table 4. This result ensured that the biosorption was successfully completed. Thus, EDS analysis confirmed that ion exchange is one of the most predominant process involved in the biosorption of heavy metals by B. nigra [63].
| Wavenumber (cm‒1) | Intensity | Functional Group | Group Name |
|---|---|---|---|
| 3304.06 | Medium | ‒OH | Hydroxyl/Phenol |
| 2885.51 | Strong | C‒H | Alkane |
| 1762.92 | Strong | C=O | Carboxylic acid |
| 1751.36 | Strong | C=O | Carboxylic acid |
| 1734.01 | Strong | C=O | Carboxylic acid |
| 1724.36 | Strong | C=O | Carboxylic acid |
| 1654.92 | Strong | N‒C=O | Amide |
| 1595.13 | Strong | C‒N | Amide 1° bending vibration |
| 1425.40 | Medium | C‒O‒H | Carboxylic acid bending |
| 1246.02 | Medium | C‒O‒C | Ether |
| 1043.49 | Medium | CO‒O‒CO | Anhydride |

3.3. Effect of PH
The biosorption is controlled by the pH and is favored with the increase of this parameter because the degree of dissociation of the functional groups from the surface of the biosorbent and the solubility of the metal ion increased [64-66]. Fig. (7) shows the effect of pH on Pb (II) biosorption. The potential of Hydrogen can also affect the surface characteristics of the biosorbent [46]. In Fig. (7), when the Pb (II) concen- tration was 5 ppm the capacity of adsorption was low, the metal uptake increased from 4.1 to 7.2 mg/g. However, adsorption was favored when the Pb (II) concentrations were 15 ppm (from 7.4 to 20.8 mg/g) and 30 ppm (from 10.0 to 27.0 mg/g). This behavior of the pH dependency of metals uptake is due to the association and dissociation of the functional groups such as carboxyl and hydroxyl groups. At low pH, most of the carboxylic groups were not dissociated and could not bind the metal ions to the cell wall [67]. The capacity of biosorption for 5, 15 and 30 ppm when the pH is between 4 and 5 was kept constant because all the active sites are filled. Other studies show this same biosorption behavior of Pb (II) with the pH with other biosorbents; the effect of pH on the adsorption of dyes is an important parameter, and it has this same behavior [42].
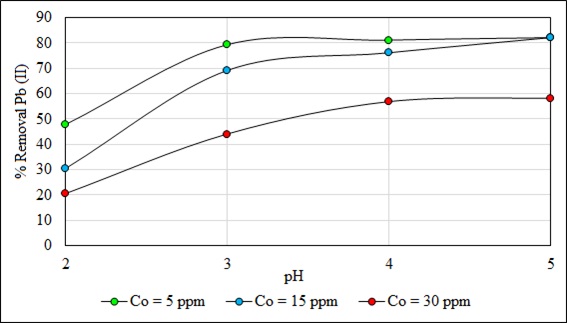
Fig. (8) shows the percentage of Pb (II) removal dependent on pH. The removal is favored with the increase of the pH. However, the removal is also favored when the concentration of Pb (II) ions diminished. At pH 5 there were no differences in the removal of Pb (II), when the concentrations were 5 and 15 ppm, the maximum removal reached were 82.2%, but with 30 ppm at pH 5 the (%) removal was only 58%. This can be attributed to the lack of enough surface area to adsorb more ions, producing a competition between the metal ions to reach an active site of the biosorbent. Other studies also show the same behavior for the adsorption of Pb (II) [68] and Ni (II) [69]. At a higher pH, the Pb (II) ions precipitate in the form of hydroxides. This reduces the rate of adsorption and conseq- uently the removal capacity of heavy metals [28]. The pH is an important controlling factor in the heavy metal adsorption process which affects the surface charge of the biosorbent material.

3.4. Effect of Particle Size
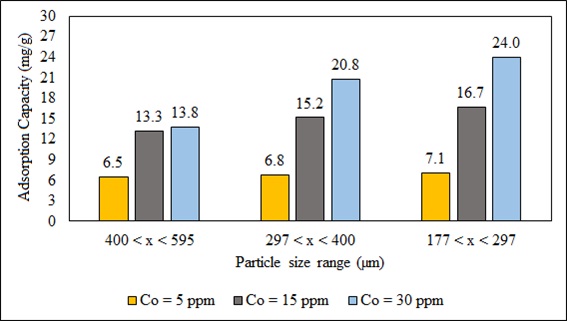
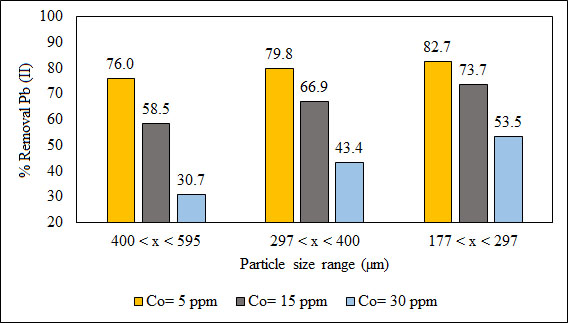
The capacity of adsorption of the biosorbent depends on the particle size and the structure of its inner surface area [70]. Fig. (9) shows the effect of particle size on the biosorption of Pb (II). The higher adsorption with smaller adsorbate particles may be attributed to the fact that smaller particles provide a larger surface area; the surface area and the greater availability of active sites rise the mass transfer because they reduce internal diffusion. B. nigra is a low porosity material (Fig. 4), so internal pore diffusion is not a relevant factor. Other studies with different biosorbents also show this same behavior [71, 72].
Fig. (10) shows the effect of particle size on the removal of Pb (II) ions. (%) Removal increases with decreasing particle size as well as decreasing the initial concentration of Pb (II) ions. For a particle size varying in a range of 177 < x (μm) < 297, the highest removal of 82.7% was obtained when the initial concentration of the Pb (II) ion was 5 ppm. It is important to consider that the removal also depends on the affinity of the adsorbate for the adsorbent. The functional groups shown in Table 2 by B. nigra are polar. Therefore, polar substances will be easily collected by the B. nigra than non-polar ones.
3.5. Effect of Biosorbent/Solution
The study of natural biosorbent dosage or biosorbent /solution was carried out at different adsorbent doses (10, 30 and 50 mg) using 50 mL of the metallic ion solution. Fig. (11) and Fig. (12) show the influence of the biomass/solution ratio on the adsorption capacity and percentage of removal at pH 5, with a particle size of 177 < x (μm) < 297.
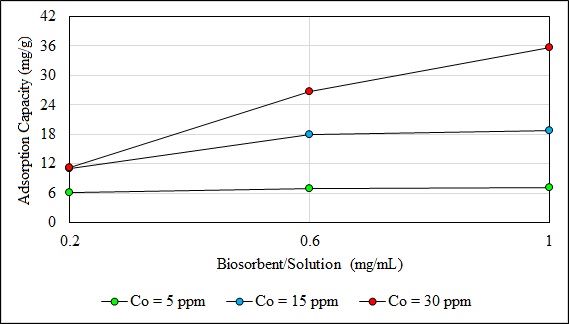

In general, the capacity of adsorption of the biomass increases with the biosorbent dosage because this increases active exchangeable adsorption sites [47]. However, the overall biosorption of the adsorbate per unit weight of biosorbent can decrease due to interference caused by the interaction of active sites of the biosorbent [73-75].
The adsorption capacity at 5 ppm did not show an important effect with the increase of this ratio. This parameter increased when the concentration of Pb (II) ions was 15 and 30 ppm; and the ratio from 0.2 to 1. When the concentration of Pb was 30 ppm the maximum capacity of biosorption (35.7 mg/g) was reached. The (%) removal of Pb (II) ions increased when the ratio increased from 0.2 to 1. The maximum removal Pb (II) of 83.4% (5 ppm) was achieved with a ratio of 1. This result may be due to the increase in the availability of active surface sites because of the increase of the biosorbent dose. When the adsorption dose reached a certain rate, the adsorption sites are depleted. Therefore, the capacity of adsorption of the biosorbent diminished and the rate of metal ion removal no longer increases [76, 77].
3.6. Kinetic Studies
Fig. (13) shows the effect of contact time on the final concentration of Pb (II) and the percentage of removal of this metal ion. The contact time significantly affected the adsorption process. Thus, contact time can influence the economic efficiency of the process as well as the adsorption kinetics [47, 78]. This experiment was performed with the lowest (5 ppm) and the highest (30 ppm) concentration. The transfer of Pb (II) by adsorption on B. nigra increases with time and final values in the solutions were 0.46 ppm (90.34% removal) and 9.75 ppm (60.31% removal) at 605 min and then remained constant. It is clear that The percent removal was greater with lower initial concentration than with higher initial concentration. The equilibrium was established in 605 minutes and was independent of Pb (II) concentration in water. The curves of Fig. (13) are clear and continuous indicating the formation of an adsorbate monolayer on the surface of the biosorbent. Similar results have been reported by other workers for other adsorbate-adsorbent systems [79, 80].
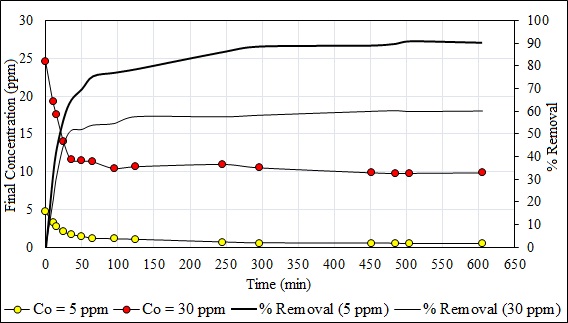
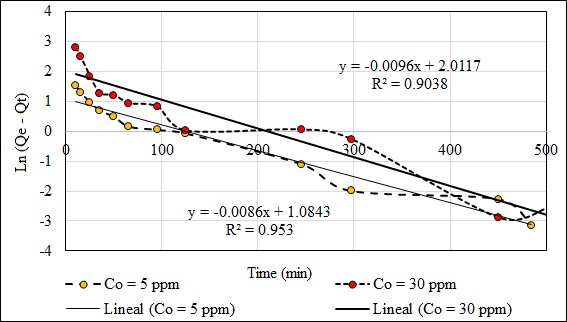
Fig. (14) shows the kinetic model of pseudo-first order of Pb (II) at 5 and 30 ppm. The capacity of adsorption in the equilibrium (Qe) was of 7.167 mg/g in 605 minutes. The value of the capacity of adsorption in the minute 505 was eliminated because the value of Ln (Qe - Qt) does not exist. Fig. (15) shows the kinetic model of pseudo-second order of Pb (II) at 5 and 30 ppm. The capacity of adsorption in the equilibrium (Qe) was 24.68 mg/g in 605 minutes. The value of the adsorption capacity after 485 minutes was eliminated because the value of Ln (Qe – Qt) does not exist. The best fit model is the second-order kinetic model with the experimental data when the concentrations are 5 and 30 ppm with a correlation coefficient value R2 = 0.9998 and 0.9997, respectively. The second order kinetic model best represents the experimental data when the concentrations are 5 and 30 ppm with values R2 ≈ 1. Similar results with other adsorbents are shown in another study [80]. The constants of Eq. 2 and 3 are shown in Table 5. The initial adsorption rate (Eq. 5) was evaluated for both concentrations as a pseudo second-order model: h (Co = 5 ppm) = 0.4246 mg/g.min and h (Co = 30 ppm) = 2.1287 mg/g.min.
| Before Biosorption | After Biosorption | ||||
|---|---|---|---|---|---|
| Element | Mass (%) | Atomic (%) | Element | Mass (%) | Atomic (%) |
| C | 52.31 | 59.62 | C | 58.63 | 66.18 |
| O | 42.95 | 36.75 | O | 35.73 | 30.28 |
| N | 2.97 | 2.90 | N | 3.36 | 3.25 |
| K | 0.85 | 0.30 | P | 0.23 | 0.10 |
| S | 0.42 | 0.18 | Na | 0.12 | 0.07 |
| Si | 0.30 | 0.15 | Pb | 1.94 | 0.13 |
| Na | 0.11 | 0.07 | ‒ | ‒ | ‒ |
| P | 0.10 | 0.04 | ‒ | ‒ | ‒ |
| 100 | 100 | 100 | 100 | ||

| Pb (II) (5 ppm) | Pb (II) (30 ppm) | |||
|---|---|---|---|---|
| Kinetic Model | Parameters | Correlation (R2) | Parameters | Correlation (R2) |
| Pseudo First Order | k1 = 0.0086 min‒1 | 0.9530 | k1 = 0.0096 min‒1 | 0.9038 |
| Qe = 7.167 mg/g | Qe = 24.675 mg/g | |||
| Pseudo Second Order | k2 = 7.772x10‒3 g/mg.min | 0.9997 | k2 = 3.355x10‒3 g/mg.min | 0.9998 |
| Qe = 7.391 mg/g | Qe = 25.189 mg/g | |||
| h1 = 0.4246 mg/g.min | h2 = 2.1287 mg/g.min | |||
3.7. Equilibrium Studies
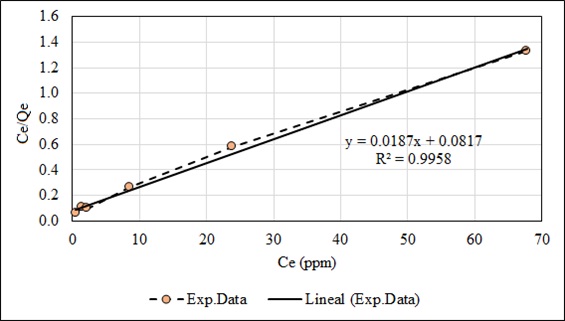
An adsorption isotherm describes the relationship between the amount of adsorbate uptaken by the biosorbent and the adsorbate concentration remaining in solution. To obtain the constants of the linearized models of the Langmuir (Eq. 6) and the Freundlich (Eq. 7) isotherms, experiments were carried out with initial concentrations of 5, 10, 15, 30, 50 and 100 ppm, until reaching the equilibrium in each case. The Langmuir model better represents the experimental data than the Freundlich model indicating the homogeneous and unilayered nature of the adsorption process (Fig. 16 and 17). The constants of these models are given in Table 6. The Freundlich parameter 1/n relates to surface heterogeneity. When 0 < 1/n <1, the adsorption is favorable; 1/n = 1 the adsorption is homogeneous, and there is no interaction among the adsorbed species. 1/n > 1, the adsorption is unfavorable [82]. Another way to analyze the constant ‘n’ is if its value is greater than one. The Freundlich isotherm is favorable. The values of Ce when plotted against the values of Ce/Qe (Langmuir isotherm) gave a straight line (R2 = 0.9958) for Pb (II), indicating an excellent fitting of the adsorption data in comparison with the Freundlich isotherm (R2 = 0.9397). A study developed with Salvinia biomass shows that the Freundlich isotherm excellently represents the adsorption data. The capacity of plant biomass is mainly attributed to physico-chemical characteristics such as high content of carboxylic and carbonyl groups [83].

| Langmuir constants | Freundlich Constants | |||||
|---|---|---|---|---|---|---|
| Q max. (mg/g) | KL (L/mg) | R2 | KF | n | R2 | |
| 53.476 | 0.22888 | 0.9958 | 12.537 | 2.701 | 0.9397 | |
| Co (mg/L) | 5.25 | 9 | 15.2 | 28 | 48.51 | 98.38 |
| RL | 0.45421 | 0.32681 | 0.22327 | 0.13498 | 0.08263 | 0.04252 |
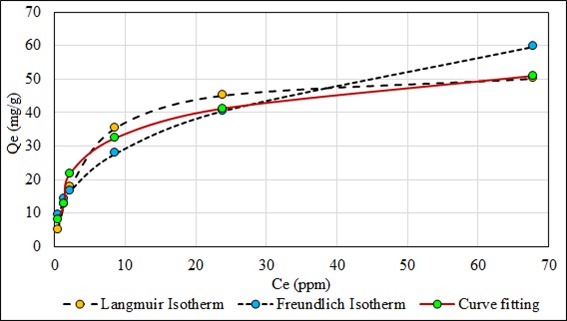
Table 6 shows the different values of the separation factor RL (Eq. 8) determined from different initial concentrations 5.25, 9, 15.20, 28, 48.51, and 98.38 ppm. The values of this factor are in the range 0 < RL < 1, indicating that adsorption is favorable; which corroborates the high affinity of the adsorbate with the homogenous surface of the biosorbent, also it means there is a very strong bond between the adsorbate and the biosorbent.
Fig. (18) shows the Langmuir and the Freundlich isotherms compared to the experimentally obtained fit curve. The high affinity of the adsorbate with the adsorbent is observed with the Langmuir isotherm, verified with the linear correlation factor (R2) and the equilibrium factor (RL), which indicates that the maximum adsorption of the contaminating metal is homogeneous, monolayer by the same mechanism of chemisorption.
3.8. Desorption Experiments
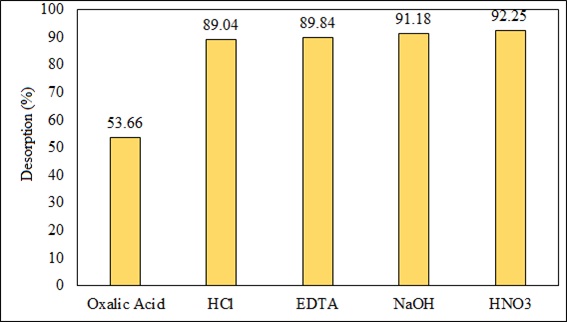
Desorption is the process of removing adsorbed metal from the adsorbent. Fig. (19) shows the responses obtained in the study of desorption, which allowed us to know the best eluent agent with a concentration of 0.1 N that has the ability to recover the highest percentage of the adsorbed metal to regenerate the biosorbent without damaging the wall of the biomass. The best response was obtained with HNO3 (92.25% removal) and the least favorable one with oxalic acid (53.66% removal). Sodium hydroxide also had a good response because desorption was greater than 90%. The regeneration and reusability of biosorbent were important for keeping the process costs low, reducing the dependency of the process on the continuous supply of biomass, and it also helps in recovering and pre-concentrating the metal ions extracted from the liquid phase [84, 85]. Desorption of metal ions in acidic media appeared to be rapid and higher than in basic and neutral media [86]. Various acids such as HCl, H2SO4, HNO3, HCOOH, and CH3COOH were used for desorption of heavy metals in various studies. Low pH favored desorption and/or dissolution of metal cations because the biomass was leached with diluted acid; the mechanism of metal ion exchange increased the acidity of the solution. NaOH was found to be quite effective for metal recovery up to 94.6-98.3%, only a small fraction of Pb (II) could not be recovered by regeneration due to very strong bond [86, 87]. The method developed in this work could be applied to real samples in a second stage of research. The results in this first phase were very encouraging with Pb (II) removal levels greater than 80%, in addition to the preparation of B. nigra as a biosorbent is cheap.
CONCLUSION
B. nigra is a very good alternative biosorbent for Pb (II) removal from aqueous solutions. The biosorbent was used without any chemical treatment presenting biosorption capacities and % removal of 6.86 mg/g or 80.26%, 17.98 mg/g or 79.32% and 26.79 mg/g or 59.87% for 5 ppm, 15 ppm and 30 ppm of Pb (II), respectively. These results were obtained in optimal conditions of pH, particle size, and biosorbent/solution ratio. The final conditions were: pH of 5; particle size between 177 and 297 µm; and, 30 mg of biosorbent per 50 mL of the solution for 2 hours. This biosorbent has low preparation cost and large availability in Canta, Lima, Peru. The B. nigra biosorbent was characterized by FTIR spectroscopy indicating the presence of carboxylic groups (‒COOH). This functional group is responsible for the attraction of the metal ion Pb (II) of the solution to form new complex bonds. Thus, EDS analysis confirmed the presence of lead after biosorption. Ion exchange is also one of the most predominant process involved inthe biosorption of heavy metals. The adsorption of the metallic ions depended on pH and shaking contact time. The minimum shaking contact time necessary for reaching the equilibrium was about 605 min, for 5 ppm and 30 ppm of Pb (II). The best kinetic model was the pseudosecond order. The values of R2 were 0.9997, and 0.9998 for 5 and 30 ppm of the heavy metal respectively. The model suggests that the predominant type of adsorption is of the chemisorption type. The model that describes the equilibrium of the biosorbent‒solution system is the Langmuir isotherm. The value of R2 was 0.9958. In addition, the separation factor or equilibrium factor (RL) for the range from 5 to 100 ppm was between 0 to 1. These results express favorable adsorption. Finally, the best eluent for Pb (II) desorption from the biosorbent without damaging its surface was nitric acid (HNO3) at 0.1 N.
ETHICS APPROVAL AND CONSENT TO PARTICIPATE
Not applicable.
HUMAN AND ANIMAL RIGHTS
No animals/humans were used for studies that are the basis of this research.
CONSENT FOR PUBLICATION
Not applicable.
AVAILABILITY OF DATA AND MATERIALS
Not applicable.
FUNDING
None.
CONFLICT OF INTEREST
The authors declare no conflict of interest, financial or otherwise.
ACKNOWLEDGEMENTS
The authors wish to thank the National University of Engineering (UNI) from Lima, Peru, especially the Department of Sciences for letting us use the chemistry laboratory, as well as the different equipment for the analysis that we carry out during this study. We would also like to thank the Faculty of Chemical and Textile Engineering (FIQT) for its support with chemical reagents.

