All published articles of this journal are available on ScienceDirect.

Optimization of Process Parameters for Cholesterol Oxidase Production by Streptomyces Olivaceus MTCC 6820
Abstract
Background:
Streptomyces olivaceus MTCC 6820 is a potent microorganism for cholesterol oxidase (ChOx) production through the submerged fermentation process. Statistical optimization of the process parameters for submerged fermentation enhances the production of enzymes.
Objective:
This work is aimed to optimize the culture conditions for the fermentative production of cholesterol oxidase by Streptomyces olivaceus MTCC 6820 using combined Response Surface Methodology (RSM) and Artificial Neural Network (ANN) techniques.
Methods:
The ChOx production (U/ml) was modeled and optimized as a function of six independent variables (culture conditions) using RSM and ANN.
Results:
ChOx production enhanced 2.2 fold, i.e 1.9 ± 0.21 U/ml under unoptimized conditions to 4.2 ± 0.51 U/ml after the optimization of culture conditions. Higher coefficient of determination (R2 = 97.09 %) for RSM and lower values of MSE (0.039) and MAPE (3.46 %) for ANN proved the adequacy of both the models. The optimized culture conditions predicted by RSM vs. ANN were pH (7.5), inoculum age (48 h), inoculum size (11.25 % v/v), fermentation period (72 h), incubation temperature (30°C) and shaking speed (175 rpm).
Conclusion:
The modeling, optimization and prediction abilities of both RSM and ANN methodologies were compared. The values of Pearson correlation coefficient (r) (ANN0.98 > RSM0.95), regression coefficient (R2) between experimental activity, RSM and ANN predicted ChOx activity, respectively (ANN0.96 > RSM0.90) and Absolute Average Deviation (AAD) for (ANN3.46% < RSM9.87%) substantiated better prediction ability of ANN than RSM. These statistical values indicated the superiority of ANN in capturing the non-linear behavior of the system.
1. INTRODUCTION
Cholesterol oxidase (EC 1.1.3.6) is a bi-functional (Flavin Adenine Dinucleotide) FAD-dependent enzyme. It catalyzes the oxidation of cholesterol (5-cholesten-3-ol) to an inter-mediate 5-cholesten-3-one, and its further isomerization to form 4-cholesten-3-one by the conversion of Δ5-bond to a Δ4-bond [1, 2] with the concomitant reduction of molecular oxy-gen to form hydrogen peroxide [3]. The microbial production of ChOx has gained substantial attention in recent times mainly due to their useful biotechnological applications in the field of clinical pathology [4, 5], pharmaceuticals [6-8], agriculture [9, 10] and food industries over past few decades. In the last decade, ChOx has been predominantly used for the develo-pment and fabrication of different types of biosensors /nano-biosensors for monitoring serum cholesterol detection [11]. Despite their widespread potential applications, the commercial production of ChOx is still a challenging aspect, due to its low yield through fermentation process [12, 13]. There are some underlying reasons behind this fact; firstly, the production and availability of ChOx are confined only to the microbial fermentation process, on the other hand, no other sources (animal or plant) have been documented till date. Secondly, the production of ChOx by several microorganisms mostly exhibits inducible expression pattern, i.e. no constitutive expression of ChOx gene. Thirdly, pathogenicity of producer organism is also a problem in some cases, while some others are intracellular ChOx producers. These reasons not only limit its production but also marks it an expensive enzyme for industrial as well as clinical applications.
The over-production of ChOx through various approaches has been the matter of current interest amongst the researchers worldwide. One of the primary strategies applied for maxi-mizing yield in fermentative production of enzyme and metabolites is the optimization of process parameters. The opti-mized cultural conditions viz. medium pH, incubation tem-perature, inoculum size, inoculum age, fermentation period and shaking speed enhance the microbial production of enzymes and biochemicals under submerged fermentation. The optimi-zation of process parameters in biological systems is yet a cumbersome task. The optimization of culture conditions and physicochemical parameters for the fermentative production of various enzymes using RSM has widely been performed by researchers worldwide [14-16]. The application of model-based optimization approach (such as Central Composite Design-Response Surface Methodology (CCD-RSM), Artificial Neural Network (ANN), and Genetic Algorithm (GA)) in the field of bioengineering, has been well documented [17-20].
The conventional ‘One Factor at A Time’ (OFAT) approach of process optimization has certain limitations pertaining to improper resource utilization, inaccuracy, and false-optimum prediction. The OFAT is often time-consuming and also fails to study the interaction of different process variables involved, which affects the final yield [21]. The six fermentation parameters in submerged fermentation as mentioned above have interactive effects on the production of ChOx. RSM is an empirical tool provided with a combination of statistical and mathematical methods used for designing factorial experi-ments, building experimental models and determining the relative significance of each independent variable [22]. The optimum predicted by RSM follows the statistical approach where the quantitative data from appropriate experiments are used to solve the multivariate equation. RSM overcomes the limitations of OFAT approach with a significant reduction in the number of experimental trials for the evaluation of multiple parameters and their interactions, thus making efficient manag-ement of time as well as resources [15, 20]. RSM is based on the assumption of linear quadratic correlation for optimizing the response. The complexity of interactions increases with the increase in variables (more than 7), as the biological systems mostly represent complex non-linear relationships. RSM fails to explain the object function accurately in such cases; consequently, RSM could not explain complex interactions [23].
In recent times, Artificial Intelligence (AI) has emerged as an attractive tool for developing non-linear empirical models and optimizing the multifactor time-variant bioprocess [23-27]. ANN is a biologically inspired computational tool, which mimics the nervous system in the human body, where the neuron functions as fundamental processing units. Artificial neurons in ANN receive the input signal in the form of weights, each weighted signal corresponds to some biases in the hidden layer, and as a result of non-linear mapping, the final output signal is the product of weights and biases. ANN offers a sophisticated mathematical model which overcomes the shortcomings of regression models for noisy data and successfully accounts for the optimization and nonlinear modeling of complex biological processes. The learning algo-rithm of ANN enables it to recognize and establish the cause-effect relationship through training for multiple input-output systems, and the performance evaluation is done on the unseen set of data, which makes it efficient for even more complex systems [23, 25].
In our previous paper, we optimized the assay conditions for the estimation of ChOx by a new species of Streptomyces i.e. Streptomyces olivaceus MTCC 6820 using ANN [28]. In the present paper, we generated a Central Composite Design (CCD) based experimental design. RSM coupled with ANN was employed to optimize the culture conditions viz. medium pH, incubation temperature, inoculum size, inoculum age, fermentation period and shaking speed for augmenting the ChOx production by S. olivaceus MTCC 6820. A comparative performance evaluation of RSM and ANN techniques was done. To the best of our knowledge, the ChOx production by this microbe; Streptomyces olivaceus MTCC 6820 has been reported for the first time.
2. MATERIALS AND METHODS
2.1. Chemicals Used
All the chemicals used were of analytical grade. Choles-terol was purchased from the Sigma Aldrich Pvt. Ltd and Horseradish peroxidase was purchased from Sisco Research Laboratories, Mumbai, India.
2.2. Microorganisms and Culture Conditions
Streptomyces olivaceus MTCC 6820, used in this study was procured from Microbial Type Culture Collection, Institute of Microbial Technology, Chandigarh, India and was main-tained in the Streptomyces growth medium containing (g/L): glucose – 4, yeast extract – 4, malt extract – 1, CaCO3 – 2 and Agar – 12 and the pH was adjusted to 7.2 with KOH. The aseptically inoculated slants were incubated at 30 ± 2ºC for 48 - 72 h for the growth of the organism; the cultures were preserved at 4ºC in the refrigerator and were routinely sub-cultured in every 30 days interval.
2.3. Fermentation Studies
The inoculum was prepared by scraping the spores of Streptomyces from the slants into 3ml of sterile distilled water, and the spore suspension was homogenized before transferring into 50 ml sterile seed medium in a 250 ml Erlenmeyer flask. The flask was incubated at 30 ± 2ºC for 48 h in an orbital shaker (Orbitek, Scigenics Biotech Pvt. Ltd., Chennai, India) at 150 rpm. The production medium of cholesterol oxidase contained (g/L): cholesterol- 2, glucose – 12, starch – 9, yeast extract - 6, peptone – 4, (NH4)2SO4 – 7.5, cholesterol - 2, K2HPO4 – 1, MgSO4 – 0.5, NaCl – 1, MnSO4 – 0.008, CuSO4 – 0.002, ZnSO4 – 0.002, FeSO4 – 0.02, CaCl2 – 0.0002 and Tween 80 – 10 ml [12]. Cholesterol was homogenized into the medium by ultra-sonication (Hielscher Ultrasound Technology, UP200S, Germany) for 15 min to avoid the deposition of undissolved cholesterol into the medium and the pH was adjusted to 7.5 before sterilization. The composition of the seed medium and the production medium remained the same. Fermentation was carried out in 250 ml Erlenmeyer flasks containing 50 ml of production medium. The production medium was inoculated with 10% (v/v) of inoculum of 48 h old Streptomyces culture. The inoculated flasks were incubated at 30 ± 2ºC for 120 h at 180 rpm in an orbital shaker. Samples were collected at every 12 h intervals and centrifuged at 12,000 rpm at 4ºC in an ultracentrifuge for 20 min. The supernatant was collected as a source of crude extract of extracellular ChOx.
2.4. Enzyme Assay and Protein Estimation
ChOx activity was estimated by the modified method of Allain et al. [1, 4]. In this biochemical reaction, hydrogen peroxide (H2O2) is liberated by the ChOx-mediated oxidation of cholesterol in the presence of molecular oxygen. This H2O2 is coupled with 4-aminoantipyrine and phenol by peroxidase to produce Quinoneimine dye with the absorption maxima at 500 nm. The ChOx assay parameters for S. olivaceus MTCC 6820 were optimized using Response Surface Methodology (in our previous work) and the optimal values so obtained were used for the assay of ChOx in further experiments.
50 µL of 0.6 % cholesterol (dissolved in dimethyl forma-mide containing 5 %(v/v) Triton X-100) was added to 1 ml of reaction mixture containing 1.5 mM 4-aminoantipyrine, 5 mM phenol, 10 U/ml horseradish peroxidase and sodium phosphate buffer (20 mM, pH 8.0) and pre-incubated for 5 min at 30ºC. 100 µL of crude enzyme extract was added to the pre-incubated reaction mixture to start the reaction, and the incubation continued for 10 min at 30ºC. The reaction was terminated by placing the samples in a boiling water bath for 2 min and then immediately placed in an ice bath for 2 min for (pink) color development. The absorbance was recorded at 500 nm by the discontinuous spectrophotometric method (UV 1800 Spectro-photometer, Shimadzu, Japan). Blank was prepared by adding an inactivated enzyme sample to the reaction mixture. No color was produced in the control containing inactivated ChOx. One unit of ChOx activity was defined as the formation of 1 µmol of hydrogen peroxide (0.5 µmol of quinoneimine dye) per minute at 30ºC, pH 8.0.
Protein concentration was determined by Bradford’s method using Coomassie Brilliant Blue G-250 dye. The standard curve of Bovine Serum Albumin (BSA) with concen-trations ranging from 0.01 to 0.2 mg/ml was prepared taking absorbance at 595 nm [29].
2.5. Experimental Design
A five-level-six factor CCD was employed using Minitab statistical software package, version 17.0 to generate the experimental design matrix consisting of 53 experimental trials. Six fermentation parameters viz. pH of media (X1), inoculum age (X2), inoculum size (X3), fermentation period (X4), incubation temperature (X5) and shaking speed (X6) were chosen as the independent variables, their coded and uncoded levels are displayed in Table 1. The design matrix comprised of nine replications at center points in order to evaluate the curvature and to simplify the pure error estimation, so that the significant lack of fit of the models could be predicted [30]. The experimental runs were randomized to minimize the effects of unexpected variability in the observed responses. The response surface is a multivariable polynomial model intended to determine optimum set points for the above mentioned independent variables to optimize the dependent variable or response (Y) viz. ChOx concentration (U/ml) in this study. The ChOx activity for each experimental run was estimated in duplicate, and their average values were presented in Table 2. The experimental data were further analyzed using multiple regression and a second-order polynomial model fitted for predicting optimal levels was expressed in Eq. (1):
 |
(1) |
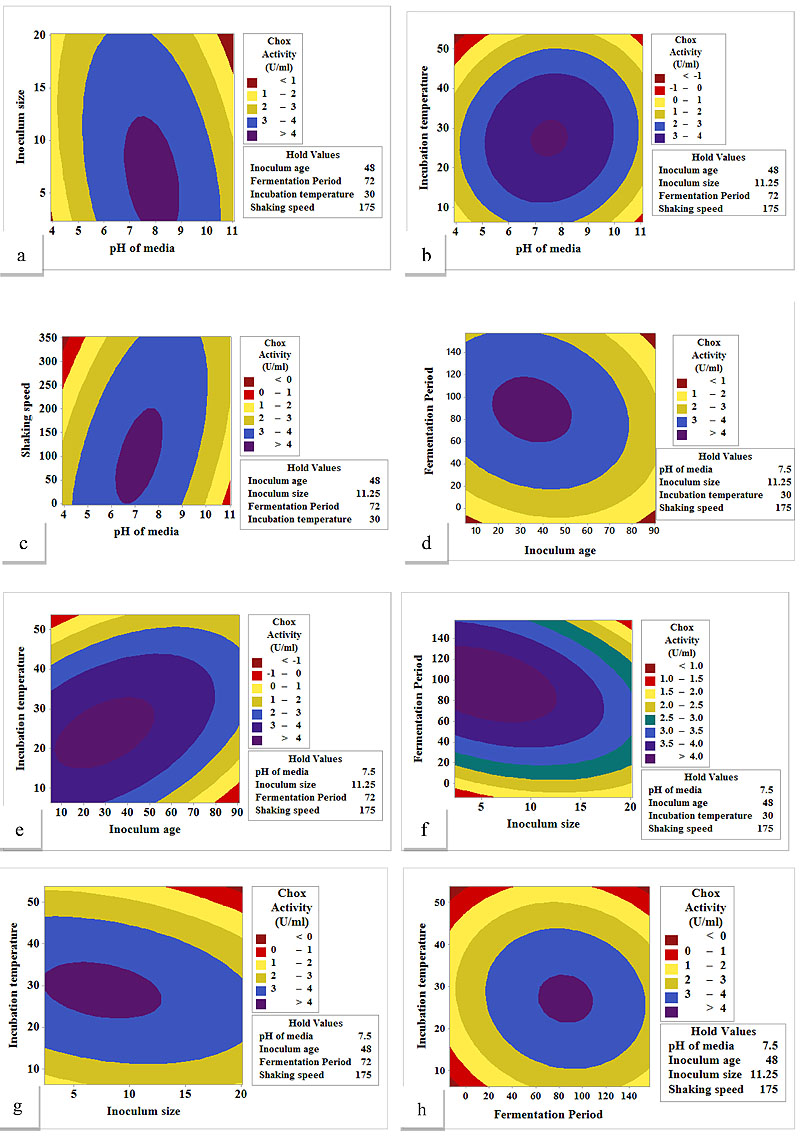
where, Y is the predicted response, β0 is the intercept coefficient, βi is the linear coefficient, βii is the quadratic coefficient, and βij is the interaction coefficient. The effect of the variables on the response and their interaction has been analyzed by conducting tests of significance and Analysis of Variance (ANOVA) to check the adequacy of the model. The optimized variables were chosen by using the response optimizer function of Minitab 17.0 software. The interactive effects of significant variables were represented in the form of contour plots as shown in Fig. (1a-h).
| Factor Codes | Independent Variables | Unit | Coded Factor Levels | ||||
|---|---|---|---|---|---|---|---|
| -α | -1 | 0 | +1 | +α | |||
| X1 | pH of media | - | 3.9324 | 6 | 7.5 | 9 | 11.0676 |
| X2 | Inoculum age | hours | 5.1885 | 30 | 48 | 66 | 90.8115 |
| X3 | Inoculum size | % (v/v) | 2.3309 | 7.5 | 11.25 | 15 | 20.1691 |
| X4 | Fermentation period | hours | -13.623 | 36 | 72 | 108 | 157.623 |
| X5 | Incubation Temperature | °C | 6.2159 | 20 | 30 | 40 | 53.7841 |
| X6 | Shaking speed | rev/min (rpm) | -3.381 | 100 | 175 | 250 | 353.381 |
| Run Order | pH of Media | Inoculum Age | Inoculum Size | Fermentation Period | Temperature | Shaking Speed | ChOx Activity (U/ml) | ||
|---|---|---|---|---|---|---|---|---|---|
| Experimental Observed | RSM Predicted | ANN Predicted | |||||||
| 1 | 7.5 | 48 | 11.25 | -13.623 | 30 | 175 | 1.500 | 1.7608 | 1.50 |
| 2 | 7.5 | 48 | 11.25 | 72 | 30 | 175 | 3.890 | 4.0511 | 4.0617 |
| 3 | 7.5 | 48 | 11.25 | 72 | 30 | 175 | 4.040 | 4.0511 | 4.0617 |
| 4 | 9 | 66 | 7.5 | 108 | 20 | 250 | 3.040 | 2.8916 | 2.9653 |
| 5 | 6 | 66 | 15 | 36 | 20 | 100 | 2.800 | 2.6103 | 2.8000 |
| 6 | 9 | 30 | 15 | 36 | 20 | 100 | 2.770 | 2.6230 | 2.7701 |
| 7 | 6 | 30 | 15 | 108 | 40 | 250 | 1.540 | 1.5855 | 1.5399 |
| 8 | 9 | 30 | 15 | 108 | 40 | 100 | 2.150 | 2.1821 | 2.1500 |
| 9 | 7.5 | 48 | 11.25 | 72 | 30 | 175 | 4.150 | 4.0511 | 4.2117 |
| 10 | 6 | 66 | 15 | 108 | 20 | 250 | 1.700 | 1.9578 | 1.6999 |
| 11 | 7.5 | 48 | 11.25 | 72 | 53.7841 | 175 | 1.400 | 1.2402 | 1.4000 |
| 12 | 9 | 30 | 7.5 | 36 | 20 | 250 | 2.990 | 3.0401 | 2.9898 |
| 13 | 9 | 66 | 7.5 | 36 | 20 | 100 | 1.940 | 1.8341 | 1.4381 |
| 14 | 7.5 | 48 | 11.25 | 72 | 30 | 175 | 4.110 | 4.0511 | 4.0617 |
| 15 | 6 | 30 | 15 | 108 | 20 | 100 | 3.850 | 3.9209 | 3.8498 |
| 16 | 6 | 30 | 7.5 | 108 | 40 | 100 | 2.880 | 3.0573 | 2.8800 |
| 17 | 9 | 30 | 7.5 | 36 | 40 | 100 | 2.530 | 2.3934 | 2.5299 |
| 18 | 3.9324 | 48 | 11.25 | 72 | 30 | 175 | 1.750 | 1.6293 | 2.0265 |
| 19 | 9 | 66 | 7.5 | 36 | 40 | 250 | 2.910 | 2.7063 | 2.9099 |
| 20 | 6 | 30 | 15 | 36 | 40 | 100 | 2.240 | 2.3921 | 2.2400 |
| 21 | 6 | 30 | 7.5 | 108 | 20 | 250 | 3.500 | 3.4707 | 3.4999 |
| 22 | 7.5 | 90.8115 | 11.25 | 72 | 30 | 175 | 1.730 | 2.2532 | 1.2827 |
| 23 | 7.5 | 48 | 11.25 | 72 | 30 | 353.381 | 2.992 | 3.1280 | 3.0113 |
| 24 | 9 | 30 | 7.5 | 108 | 20 | 100 | 3.810 | 3.8522 | 3.2103 |
| 25 | 7.5 | 48 | 11.25 | 72 | 30 | 175 | 4.122 | 4.0511 | 4.0617 |
| 26 | 9 | 30 | 7.5 | 108 | 40 | 250 | 3.650 | 3.2969 | 2.9887 |
| 27 | 6 | 66 | 15 | 108 | 40 | 100 | 2.510 | 2.3804 | 2.5099 |
| 28 | 9 | 66 | 15 | 108 | 40 | 250 | 2.490 | 1.9286 | 2.4899 |
| 29 | 7.5 | 5.1885 | 11.25 | 72 | 30 | 175 | 3.670 | 3.4789 | 3.6699 |
| 30 | 7.5 | 48 | 11.25 | 72 | 30 | 175 | 4.116 | 4.0511 | 4.0617 |
| 31 | 6 | 66 | 7.5 | 36 | 40 | 100 | 2.500 | 2.6671 | 2.4999 |
| 32 | 6 | 30 | 7.5 | 36 | 40 | 250 | 2.150 | 1.6253 | 2.1499 |
| 33 | 6 | 66 | 7.5 | 36 | 20 | 250 | 1.790 | 1.6530 | 1.7899 |
| 34 | 6 | 66 | 7.5 | 108 | 40 | 250 | 1.942 | 2.1207 | 1.6703 |
| 35 | 7.5 | 48 | 11.25 | 72 | 6.2159 | 175 | 1.770 | 2.2435 | 1.7699 |
| 36 | 7.5 | 48 | 11.25 | 157.623 | 30 | 175 | 2.950 | 2.7959 | 2.950 |
| 37 | 9 | 66 | 15 | 108 | 20 | 100 | 1.850 | 1.9673 | 1.8501 |
| 38 | 9 | 66 | 15 | 36 | 20 | 250 | 2.130 | 1.9094 | 1.6292 |
| 39 | 11.067 | 48 | 11.25 | 72 | 30 | 175 | 0.740 | 1.8174 | 0.7400 |
| 40 | 7.5 | 48 | 20.1691 | 72 | 30 | 175 | 3.050 | 3.0884 | 2.6465 |
| 41 | 9 | 66 | 15 | 36 | 40 | 100 | 2.840 | 2.0986 | 2.8401 |
| 42 | 6 | 66 | 7.5 | 108 | 20 | 100 | 2.970 | 2.7009 | 2.9699 |
| 43 | 7.5 | 48 | 2.3309 | 72 | 30 | 175 | 3.440 | 4.0123 | 3.4400 |
| 44 | 7.5 | 48 | 11.25 | 72 | 30 | -3.381 | 3.894 | 3.8647 | 3.8940 |
| 45 | 6 | 66 | 15 | 36 | 40 | 250 | 1.760 | 1.7025 | 1.7599 |
| 46 | 7.5 | 48 | 11.25 | 72 | 30 | 175 | 4.083 | 4.0511 | 4.0617 |
| 47 | 9 | 30 | 15 | 108 | 20 | 250 | 3.620 | 3.4204 | 3.6197 |
| 48 | 7.5 | 48 | 11.25 | 72 | 30 | 175 | 3.989 | 4.0511 | 4.0617 |
| 49 | 7.5 | 48 | 11.25 | 72 | 30 | 175 | 4.092 | 4.0511 | 4.0617 |
| 50 | 6 | 30 | 15 | 36 | 20 | 250 | 2.890 | 2.8138 | 2.8898 |
| 51 | 9 | 30 | 15 | 36 | 40 | 250 | 1.640 | 1.7400 | 1.6399 |
| 52 | 6 | 30 | 7.5 | 36 | 20 | 100 | 2.875 | 3.0498 | 2.8748 |
| 53 | 9 | 66 | 7.5 | 108 | 40 | 100 | 3.210 | 3.0892 | 3.6338 |
2.6. ANN Modeling
A Multi-Layer Perceptron (MLP) Feed Forward Back Propagation type Neural Network (FFBP-NN) was employed using MATLAB 2012b (Math Works Inc., USA). The six determinants of ChOx production (X1, X2, X3, X4, X5, and X6; Table 1) served as network inputs. The output (ChOx concentration U/ml) was predicted by training the FFBP-NN with Levenberg-Marquardt training algorithm using MATLAB trainlm function. The selection of optimal neural network architecture and topology augments the predictability of the output. The MLP architecture of ANN essentially comprises an input, a hidden and an output layer. Different architectures of FFBP-NN were designed and trained using neural network tool-box of MATLAB 2012b (Math Works Inc., USA) and the network topology of 6-25-1 was found to be optimum, illustrated in Fig. (2). The ‘Tansig’ and ‘Purelin’ transfer functions were used in layer 1 and 2, respectively as input and hidden layers with biases at each layer. The neural network was trained and simulated on experimental values of ChOx concentration as the target, the same used for RSM, (Table 2) and the entire experimental data (53 runs) from CCD were divided into 70 %, 15 % and 15 % for training, validation, and testing respectively. The splitting of experimental data enables to measure the performance of the neural network to predict the unseen data (not used for training) and to assess the gene-ralization capability of ANN. Training was done until the network Mean Square Error (MSE) reached the lowest value and correlation coefficient (R) close to 1. The trained network models were validated using the validation data set (experi-mental data excluding the training data) for precision.
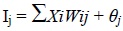
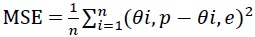
The performance of the network was evaluated in terms of mean squared error (MSE); the minimum MSE value imitates the optimum number of neurons in the hidden layer. Each input data (Xi) passed through the input layer to the hidden layer hold some weights. The inter-connection between neurons in MLP network is defined by synaptic weight (Wij), which corresponds to the extent of influence one neuron has on another, while the onset for the activation of these neurons is introduced in terms of bias (θj). The summation of the weighted outputs (XiWij) is added to the bias term (θj) and regulates the neuron input (Ij) in the outer layer, given in Eq. (2):
 |
(2) |

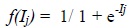
This input neuron has to further pass through an activation function f(Ij ) and transformed to output neuron by using sig-moid transform function, described in Eq. (3):
 |
(3) |
2.7. Evaluation of Model Predictability
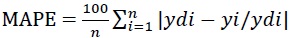
The adequacy of the developed ANN model was assessed by using Mean Squared Error (MSE) and Mean Absolute Percentage Error (MAPE), given in Eq.s (4) and (5):
 |
(4) |
 |
(5) |
where, n is the number of data points/experiments, θi, p is predicted value obtained from ANN model, θi, e is ex-perimental value, ydi is the actual response and yi is the predicted response. The efficiency of the ANN model was evaluated based on the MSE, MAPE, and regression values obtained. The network performance was evaluated by Perfor-mance plot.
2.8. Performance Evaluation of RSM and ANN Models
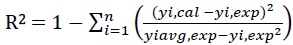
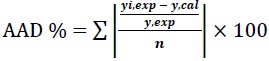
The capability of prediction efficiency of RSM and ANN were examined by comparing the predicted responses with the experimental values. The performance of the predicted response of ChOx concentration obtained from RSM and ANN were assessed in terms of coefficient of determination (R2), the Pearson’s correlation coefficient (r) and the Average Absolute Deviation (AAD). The R2 and AAD were calculated by Eqs. (6) and (7) respectively:
 |
(6) |
 |
(7) |
Where, n is the number of experimental data, yi,cal is the calculated values, yi, exp is the experimental values, yi, avg, exp is the average experimental values. R2 is a measure of the reduction in the amount of variability of the response by using the repressor variables in the model while AAD is a direct method to measure the dispersion or variability in the data [31]. AAD explains the deviation of predicted data from observed data. The value of R2 must be close to unity while the AAD between predicted and experimental data must be as small as possible [32]. Pearson’s correlation coefficient (r) is a statistical measure of the linear correlation between two variables and its value lies between +1 and -1.
3. RESULTS AND DISCUSSION
3.1. Response Surface Regression Model for ChOx Production by RSM
RSM was performed to define the interactive effects of the culture conditions on ChOx activity as well as to maximize its production. The experimental values of ChOx were fitted to the quadratic equation (Eq. 1), and the following second-order polynomial regression equation (Eq. 8) in coded units was obtained:
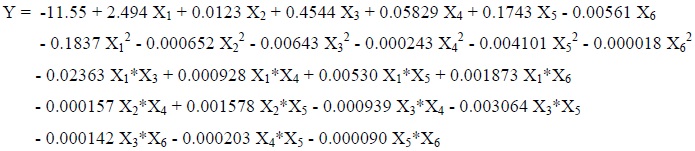 |
(8) |
Where, Y is the response (ChOx concentration, U/ml), X1, X2, X3, X4, X5, and X6 are the coded values of the independent variables viz. pH of media, inoculum age, inoculum size, fermentation period, incubation temperature and shaking speed respectively. Four interaction terms X1X2, X2X3, X2X6 and X4X6 were not found to support model hierarchy and highly insignificant (P > 0.1), therefore these terms were eliminated from the RSM model for better curve fitting.
The significance of the regression coefficient was tested by t-test. The P-values explain the significance of the interaction effects, which indicate the patterns of the interactions among the variables [32, 33]. The significance of each individual factor and their interaction effects on ChOx production were described by their corresponding P-values, (Table 3). The individual terms in the model as X2, X3, X4, X5, and X6 were significant terms, the quadratic terms as X12,X22, X32, X42, X52, X62 and the terms X1X3, X1X5, X1X6, X2X4, X2X5, X3X4, X3X5, X4X5were found to be the significant interaction terms with P-values < 0.05 (95 % confidence level, a = 0.05) . The individual term X1 was found to be insignificant (P > 0.05), but the corresponding interactions terms X1X3, X1X5, X1X6 showed significant interaction. The interaction terms X1X4, X3X6, and X5X6 were found to be insignificant with P-values > 0.05.
| Term | Coef | SE Coef | T-Value | P-Value |
|---|---|---|---|---|
| Constant | 4.0617 | 0.0677 | 60.01 | 0.000 |
| X1 | 0.0395 | 0.0309 | 1.28 | 0.211 |
| X2 | -0.2577 | 0.0309 | -8.34 | 0.000 |
| X3 | -0.1942 | 0.0309 | -6.28 | 0.000 |
| X4 | 0.2176 | 0.0309 | 7.04 | 0.000 |
| X5 | -0.2109 | 0.0309 | -6.82 | 0.000 |
| X6 | -0.1549 | 0.0309 | -5.01 | 0.000 |
| X12 | -0.4134 | 0.0264 | -15.66 | 0.000 |
| X22 | -0.2114 | 0.0264 | -8.01 | 0.000 |
| X32 | -0.0904 | 0.0264 | -3.42 | 0.002 |
| X42 | -0.3152 | 0.0264 | -11.94 | 0.000 |
| X52 | -0.4101 | 0.0264 | -15.54 | 0.000 |
| X62 | -0.0999 | 0.0264 | -3.79 | 0.001 |
| X1*X3 | -0.1329 | 0.0360 | -3.70 | 0.001 |
| X1*X4 | 0.0501 | 0.0360 | 1.39 | 0.174 |
| X1*X5 | 0.0795 | 0.0360 | 2.21 | 0.035 |
| X1*X6 | 0.2107 | 0.0360 | 5.86 | 0.000 |
| X2*X4 | -0.1017 | 0.0360 | -2.83 | 0.008 |
| X2*X5 | 0.2840 | 0.0360 | 7.90 | 0.000 |
| X3*X4 | -0.1268 | 0.0360 | -3.53 | 0.001 |
| X3*X5 | -0.1149 | 0.0360 | -3.20 | 0.003 |
| X3*X6 | -0.0399 | 0.0360 | -1.11 | 0.276 |
| X4*X5 | -0.0729 | 0.0360 | -2.03 | 0.052 |
| X5*X6 | -0.0673 | 0.0360 | -1.87 | 0.071 |
| S = 0.2034, R-sq = 97.09%, R-sq (adj) = 94.79 %, R-sq (pred) = 87.22 % | ||||
3.2. Statistical Analysis by ANOVA
Multiple regression analysis was done to analyze the RSM data. The goodness of fit of the model was described by the coefficient of determination R2, found to be 0.9709 in this case, representing 97.09 % of the sample variation attributed to the testing variables and only 2.91 % of the total variance could not be explained by the model. The R2 (adj) and R2 (pred) were found to be 94.79 % and 87.22 % respectively, which reflected a very good fit between the observed and the predicted responses, inferring that the model is reliable for ChOx production in the present study. The P value for lack of fit of the model (0.002) in Table 4, was very low which means that the model adequately describes the relationship between the factors and the response variable.
The test of significance and the adequacy of the model were presented by ANOVA (Analysis of Variance), (Table 4). The ANOVA of the quadratic regression model shows that the model is highly significant as is evident from the high F value (42.14) and very low value of P (0.000) obtained from Fisher’s F test. This implies that the combinatorial influence of all the independent variables substantially contributed to maximizing the response, i.e, ChOx production.
3.3. Contour Plots
The analysis of the interaction amongst the significant variables and prediction of their optimum conditions for ChOx production were represented with the help of contour plots (Fig. 1a-h). Interactions of pH with inoculum size, incubation temperature and shaking speed are shown in Fig. 1 (a-c), respectively, the change in color of the contour indicates that the production of ChOx was affected mainly by the change in pH of the medium as compared to other parameters studied. With the increase in medium pH, the production of ChOx increased until it reaches the optimum pH (7.5), whereas a further increase in pH decreased its production. A pH drop from 7.5 to 5.0 in the fermentation broth was observed (data not shown) after 24 h fermentation time, while the pH again increased to 7.5 after 60 h fermentation time. Since this pH drop was observed during the growth phase, it may be attributed to the acidic environment generated due to the accumulation of metabolic intermediates by the increased number of bacterial cells. Bacterial cells are impermeable to highly charged chemical species present in the medium. This allows the cell to contain a reservoir of charged nutrients and intermediate metabolic compounds, thus maintaining a significant difference between the internal and external concen-trations of small cations (ex. H+, K+, Na+) [34]. The difference in H+ ion concentration brings about the pH change in the medium. In the stationary phase (72 - 96 h), the pH was retained to 7.5 again with the maximum secretion of extracellular ChOx in the medium, which shows that the pH drop in the growth has no adverse effect on the ChOx production. It shows that the pH of the media plays an influential role in ChOx production through the submerged fermentation process. The interaction of shaking speed with pH Fig. (1c) shows maximum ChOx production at 175rpm and pH 7.5. The change in the color of contour in Fig. (1c) indicates that the ChOx production decreased on further increasing the shaking speed. Streptomyces is a shear sensitive actino-bacteria. An increase in shaking speed more than 200 rpm causes damage to the cell structure due to unbearable shear force, thereby increasing the cell mortality rate in fermentation medium leading to a reduction in the ChOx production.
| Source | DF | Adj SS | Adj MS | F-Value | P-Value |
|---|---|---|---|---|---|
| Model | 23 | 40.0950 | 1.7433 | 42.14 | 0.000 |
| Linear | 6 | 9.5948 | 1.5991 | 38.65 | 0.000 |
| Square | 6 | 24.0178 | 4.0030 | 96.76 | 0.000 |
| 2-Way Interaction | 11 | 6.4824 | 0.5893 | 14.24 | 0.000 |
| Residual Error | 29 | 1.1998 | 0.0414 | - | - |
| Lack-of-Fit | 21 | 1.1466 | 0.0546 | 8.21 | 0.002 |
| Pure Error | 8 | 0.0532 | 0.0066 | - | - |
| Total | 52 | 41.2948 | - | - | - |
The input range of the six independent variables (-1 to +1) were taken on the basis of results obtained from the pre-liminary experiments.
The interaction of inoculum age with fermentation period and incubation temperature respectively, was significant (Table 2) and showed a positive impact on ChOx production, presented in Fig. 1 (d-e). With the increase in inoculum age up to 48 h, the ChOx production increased to its maximum while subsequently decreased on further increase in inoculum age. Inoculum age of 48 h was found to be optimum for Streptomyces olivaceus, ascertaining that it is a slow-growing microorganism as compared to other bacteria. The response was also influenced by incubation temperature; increasing the incubation temp-erature above 30°C led to a decrease in ChOx production, (Fig. 1d), while it remained less influenced with fermentation period (Fig. 1e). As shown in Fig. (1f), the fermentation period has a positive impact on ChOx production and maximum production was obtained in the stationary phase which started around 72 h and lasted up to 120 h. The simultaneous increase in the fermentation period and inoculum size resulted in the enhanced ChOx production; it decreased sharply on a further increase of inoculum size beyond the optimum 11.25 % (v/v). The interactive effect of inoculum size and incubation temperature has significant positive effects, as shown in Fig. (1g), the production of ChOx improves with the increase in both the culture parameters until its optimum is reached, further increase in both the parameters causes a decline in the pro-duction of ChOx. Fig. (1h), explains an equal effect of both the culture parameters on ChOx production, as the rapid change in the color of contour indicates improvement in response with the simultaneous increase in fermentation period and incu-bation temperature till it reaches its optimum and decreases sharply on the further increase. The optimal levels of fermen-tation conditions are media pH (7.5), inoculum age (48 h), inoculum size (11.25 %), fermentation period (72 h), incubation temperature (30°C) and shaking speed (175 rpm). Graphical analysis was combined with the numerical optimization and production of ChOx obtained was 4.05 U/ml under these optimum cultural conditions.
3.4. ANN Modeling
Artificial neural network provides a non-linear mapping between the input and output variables based on the training directly from the raw data, which enables it to minimize the error between the target data and the simulated output [35]. The network architecture of 6-25-1 was found to be optimum for the prediction of desired response (Fig. 2). The adequacy of the ANN model was evaluated by the MSE and MAPE values. The MSE value was 0.039 and the MAPE value was 3.46 %. A minimum MSE value and MAPE ≤ 10 % indicates good prediction accuracy [36, 37]. The regression coefficient for training, validation, and testing (0.99) which was close to 1 indicates that the non-linearity in response was better captured by the ANN model. This proves the capability of ANN to be highly competent in representing the relationship between culture condition parameters (i.e. pH of media, inoculum age, inoculum size, fermentation period, incubation temperature and shaking speed) and ChOx production. The ANN simulated predicted values of the response (ChOx concentration, U/ml) for six different culture parameters have been given in Table 2. The maximum amount of ChOx produced was 4.2 U/ml under optimized culture conditions using the ANN methodology. The ChOx produced by S. olivaceus was in a significantly good amount as compared to the maximum ChOx obtained by other researchers in case of S. lavendulae (2.21 U/ml) [13], S. badius (1.4 U/ml) [38] and Brevibacterium sp. (1.469 U/ml) [39].
3.5. Performance Evaluation of RSM and ANN Models
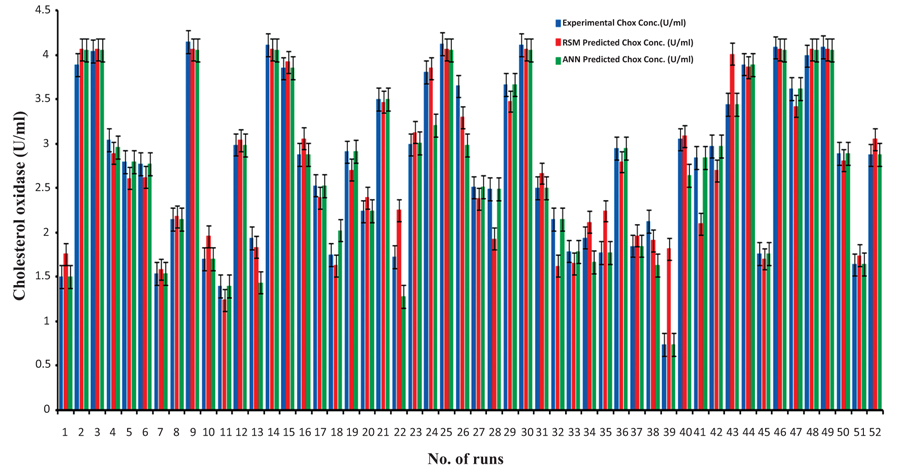
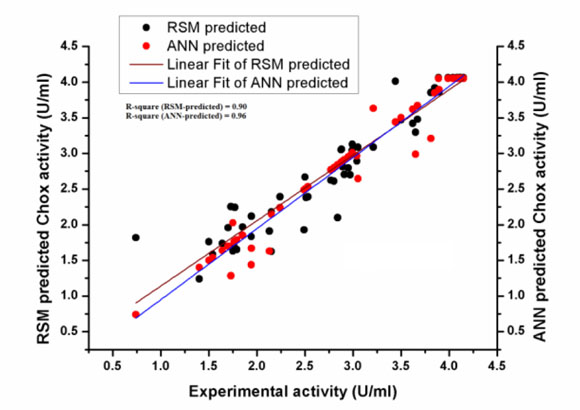
The values of ChOx activity (U/ml) predicted by ANN are closer to the actual experimental values as compared to the RSM predicted ChOx concentration (Fig. 3a). The regression coefficient (R2) between RSM predicted ChOx activity and the actual experimental production of ChOx was 0.90 whereas R2 between the ANN predicted and experimental ChOx activity was 0.96 (Fig. 3b). It means that the ANN predicted ChOx activity is more close to the experimental ChOx activity. It shows that ANN is a better predictor than RSM, so ANN model is superior to the RSM model. Pearson’s correlation coefficient (r) is a very good statistical method indicating how strong a relationship is between two variables. The value of ‘r’ (ANN0.98 > RSM0.95) shows that ANN predicted values are closer to actual experimental values as compared to the RSM predicted values. The value of ‘r' confirms that ANN is a better predictor than RSM. The Absolute Average Deviation (AAD) for ANN (3.46 %) and RSM (9.87 %) reflects a higher deviation in RSM data than ANN. Singh and Banik [18] obtained 18.47 % and 1.17% AAD values for RSM and ANN, respectively. By above three statistical measures, i.e. regression coefficient (R2), Pearson correlation coefficient (r) and AAD, it was proved that ANN methodology was superior to RSM for the prediction of experimental data.
3.6. Experimental Validation of the Model
The verification of the optimization results and accuracy of the model was accomplished by performing the experiments thrice under optimized culture conditions i.e, pH of the media (7.5), inoculum age (48 h), inoculum size (11.25 %), fermen-tation period (72 h), incubation temperature (30°C) and shaking speed (175 rpm). Under these culture conditions, the maximum ChOx produced was 4.2 ± 0.51 U/ml, which cor-responds very well to the value predicted by the ANN model.
CONCLUSION
In this paper, the optimization of physical parameters for ChOx production by Streptomyces olivaceus MTCC 6820 through submerged fermentation in shake flask culture was investigated. Both the RSM and ANN were employed to model the ChOx production (U/ml) as a function of six independent variables and their optimum conditions were found. ANN optimized and established the crucial culture parameters and their interactions affecting ChOx production. The present study signifies that ANN can be considered as an effective tool to model and predict optimum parameters for ChOx production. This study would further provide an insight into the scale-up studies of ChOx in a 5-l laboratory-scale bioreactor. The ANN model provided more accurate predictions than RSM with higher regression coefficient (R2), greater Pearson correlation coefficient (r) and lower AAD values. The ChOx production was enhanced by 2.2 fold after optimization of the culture conditions as compared to the un-optimized culture conditions (1.9 U/ml) with the maximum ChOx activity reaching up to 4.2 U/ml.
ETHICS APPROVAL AND CONSENT TO PARTICIPATE
Not applicable
HUMAN AND ANIMAL RIGHTS
No animals/humans were used for studies that are the basis of this research.
CONSENT FOR PUBLICATION
Not applicable.
AVAILABILITY OF DATA AND MATERIALS
Not applicable.
FUNDING
None.
CONFLICT OF INTEREST
The authors declare no conflict of interest financial or otherwise.
ACKNOWLEDGEMENTS
Authors are thankful to the School of Biochemical Engineering, Indian Institute of Technology (Banaras Hindu University), Varanasi, India for providing the facilities to carry out this research work. Mrs. Shraddha Sahu is also thankful to the MHRD, Govt. of India for providing financial assistance in the form of Teaching Assistant.