All published articles of this journal are available on ScienceDirect.
Experimental Study of Thermal Restraint in Bio-Protectant Disaccharides by FTIR Spectroscopy
Abstract
Background:
In the present paper, InfraRed (IR) spectra on water mixtures of two homologous disaccharides, i.e. sucrose and trehalose, as a function of temperature have been collected.
Methods:
In particular, IR spectra were registered, in the spectral range from 4000 cm-1 to 400 cm-1, to investigate the thermal response of the water mixtures of two homologous disaccharides, through positive thermal scans, i.e. by increasing the temperature from the value of 25°C to the value of 50°C. The OH-stretching region has been analyzed by means of two simple and straightforward procedures, i.e. by evaluating the shift of the intramolecular OH stretching center frequency and the Spectral Distance (SD).
Result and Conclusion:
Both the analyses indicate that trehalose water mixture have a higher thermal response than that of the sucrose-water mixture.
1. INTRODUCTION
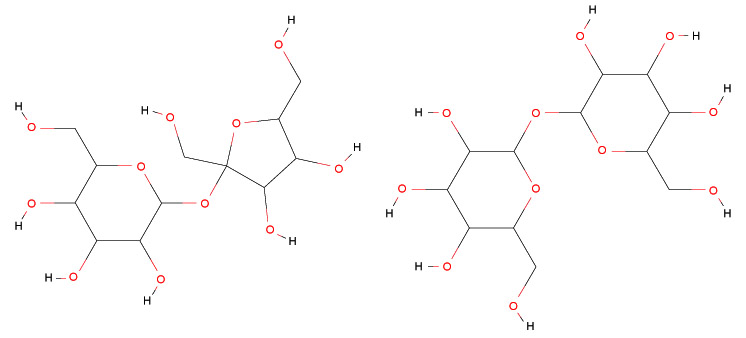
It is well known that homologous disaccharides i. e. sucrose and trehalose although have the same chemical formula (C12H22O11), they present different bio-protective properties. In particular, trehalose shows a higher bio-protective effectiveness in comparison with sucrose, playing a key role in cryptobiotic-activating substances [1-11]. Sucrose is constituted by a glucose ring in the α configuration and a fructose ring in the β configuration; the α and β structures of the same monosaccharide differ only in the orientation of the OH groups at some carbon atom in the ring itself [12-18]. Trehalose is a disaccharide of glucose constituted by two pyranose rings in the same configuration, linked by a glycosidic bond between the chiral carbon atoms C1 of the two rings [19-28].
In Fig. (1), the chemical structures of sucrose and trehalose are reported.
More precisely, trehalose, due to its bioprotective properties allows to many organisms, which synthesize it to undergo in a state of “suspended life” and to re-activate the vital functions when the external conditions come back favourable [29-42].
Thus, such organisms can resist dehydration by means of the formation of a glass of intracellular carbohydrates, that, with its high viscosity and hydrogen bonding, is able to stabilize and protect the integrity of molecules. For these reasons, the trehalose can be employed to preserve red blood cells [43-55].
It is should be stressed that trehalose possesses an unusual ability to stabilize biomolecules since it is able to stabilize the structure without interfering with the functionality of the protein [56-64].
Furthermore, the thermal properties of bioprotectant systems have been the subject of attention not only for the physical, biological and chemical research, but also for the food products and for the cultural heritage field [65-74]. Although a lot of studies have been addressed the anhydrobiosis and biopreservation phenomena; the molecular mechanisms are not yet clear [75-87]. As far as the employed spectroscopic technique is concerned, in our case, IR allows to characterize the system vibrational motions and hence the system structural arrangements and their changes with temperature. In this study, the Mid IR (MIR) region spanning from 4000 cm-1 to 400 cm-1 has been analyzed [88-92]. In particular, to highlight the thermal properties of these disaccharides mixtures, two straightforward approaches have been performed: the shift of the OH- stretching region (3700 - 3000cm-1) as a function of temperature and the analysis of the temperature dependence of the Spectral Distance (SD). From the first approach, it is possible to see changes in the spectral band position while the SD reflects the structural changes in disaccharides mixtures. Both the approaches suggest that trehalose water mixture has a higher thermal restraint than sucrose-water mixture [93-97].
2. EXPERIMENTAL SETUP AND SAMPLE PREPARATION
Sucrose and trehalose were purchased from Aldrich-Chemie. Infrared spectra were collected in the 25÷50°C temperature range, by means of the FTIR Vertex 70 V spectrometer (Bruker Optics) using Platinum diamond ATR. The investigated concentration value, expressed as weight fraction, i.e. (grams of disaccharide)/(grams of disaccharide+ grams of water), was: 0.30. For each spectrum, 32 scans were repeated at a resolution of 4 cm-1 for the spectral range between 4000 and 400 cm-1. Such experimental conditions were kept constant for all the measurements. First to proceed with the spectra analysis, data pre-processing has been performed:
- baseline treatment
- smoothing treatment
- first and second derivatives
- normalization of spectra
Then, spectral analysis has been performed by means of the software MATLAB 2016a (Mathworks, Natick, USA) and the software Origin 9 (OriginLab Co., Northampton, USA).
3. EXPERIMENTAL DATA RESULTS AND DISCUSSION
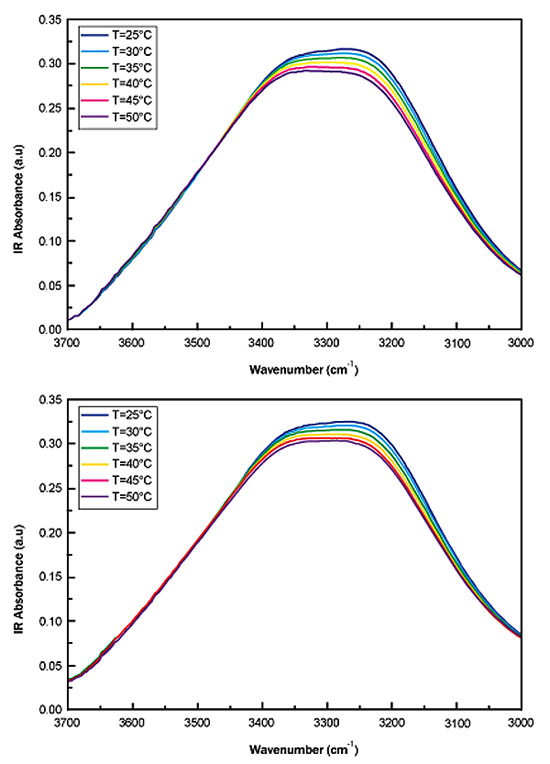
Fig. (2a) reports, as an example, the IR spectra in the OH-stretching region (3700 <Δω< 3000 cm-1 spectral range) for different values of temperature, i.e. T=25°C, 30°C, 35°C, 40°C, 45°C and 50°C for sucrose water mixture while Fig. (2b) shows, as an example, the IR spectra in the OH-stretching region (3700 <Δω< 3000 cm-1 spectral range) for different values of temperature, i.e. T=25°C, 30°C, 35°C, 40°C, 45°C and 50°C for trehalose water mixture.
To quantitatively characterizethe thermal response of the IR spectra, we have first evaluated the OH stretching center frequency shift and then the spectral distance.
In Fig. (3) the trend of the OH stretching center frequency shift for sucrose water mixture and for trehalose water mixture is reported. As it can be seen the sucrose in the temperature range 25,0°C<ΔT<50,0°C changes the intramolecular band center frequency from 3271 cm-1 to 3310 cm-1,, while trehalose changes the intramolecular band center frequency from 3264 cm-1 to 3285 cm-1.
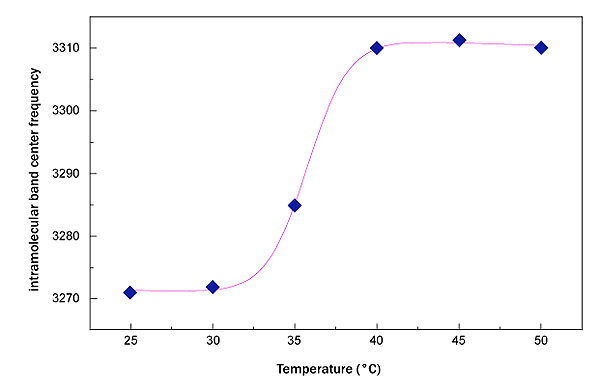
Such a result suggests a higher thermal restraint for trehalose water mixture than sucrose water mixture. In this framework, in order to extract a quantitative value and to perform a comparison between the two homologous disaccharides, an interpretative model making reference to the well known logistic function has been applied; such a procedure allows to characterize the thermal restraint of the system:
 |
(1) |
where A is the relaxation amplitude, B represents the relaxation stepness, T0 is the temperature value of the sigmoid inflection point and the contribution C-DT takes into account the low-temperature contribution. Furthermore, it is important to remember that the inverse of the relaxation amplitude is connected with the thermal restraint of the system. In Fig. (4), the fit, performed by means of equation (1), of OH-stretching band center frequency as a function of temperature for sucrose water mixture is shown.
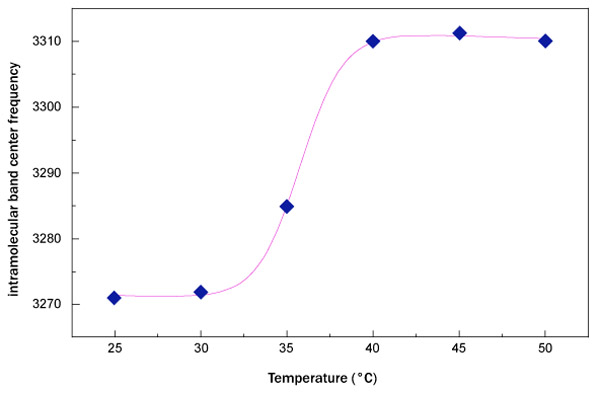
Fig. (5) reports the fit, performed by means of equation (1), of the OH-stretching band center frequency as a function of temperature for trehalose water mixture.
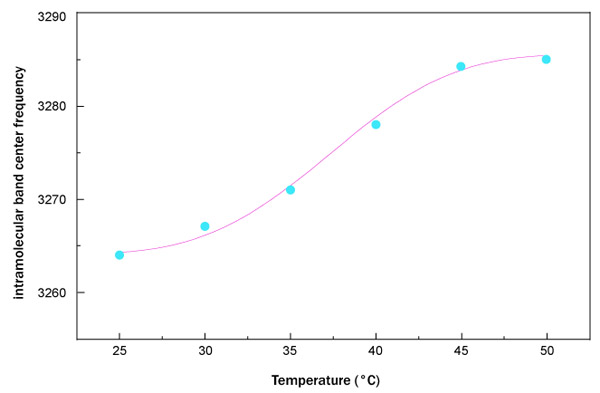
What emerges from this analysis is that the data arrange themselves along an increasing sigmoidal curve providing a higher thermal restraint, together with a higher T0 value for trehalose water mixture in respect to sucrose water mixture. More precisely, the value of thermal restraint for the sucrose-water mixture is equal to 0.024 that is lower than that of trehalose water solution whose thermal restraint value is 0.031. As far as the crossover temperature value is concerned, the value of trehalose water mixture, 37.32°C, is higher than that of sucrose water mixture, which is equal to 35.77°C. These results show that dynamics of trehalose water mixture is slower than sucrose water mixture; the trehalose has a low sensitivity to temperature changes.
In order to catch small changes in intramolecular band center frequency, the SD has been calculated by means of the following expression:
 |
(2) |
where I(ω,t) represents the absorbance as a function of frequency ω and temperature T, while ∆ω is the frequency resolution instrument.
Such a method is able to evaluate the difference in the spectra collected at different temperatures from the spectrum measured at the lowest temperature, that in our case, equal to 25 °C.
In Fig. (6), the SD of sucrose water mixture (blue diamond) and trehalose water mixture (light blue circle) is shown.
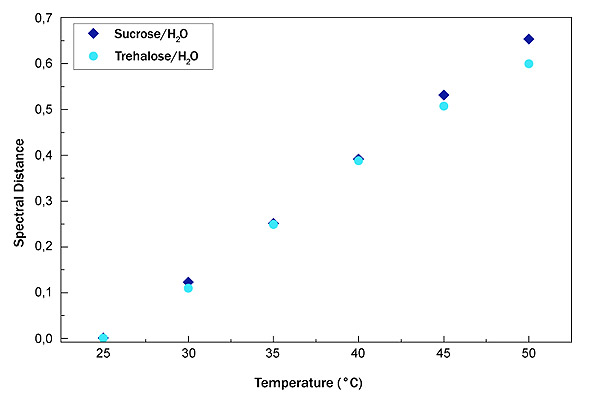
As it can be seen that the trend is linear; in order to obtain a quantitative value for the thermal response of the system, we have calculated the straight line slope. For the sucrose-water mixture, the straight line slope value is 0.02648 while for the trehalose water mixture, the slope value is equal to 0.02244.
This latter value suggests that trehalose is less sensitive to changes in temperature.
CONCLUSION
The aim of this work was to characterize the thermal response for two homologous disaccharides, i.e. sucrose and trehalose in water mixtures by FTIR spectroscopy. The spectral range investigated spanned from 4000 cm-1 to 400 cm-1,with the intramolecular OH vibrational contribution, covering the spectral range from 3000 to 3800 cm-1, in the temperature range between 25°C and 50°C.
The registered spectra have been analyzed by means of two straightforward approaches, i.e. by evaluating both the shift of the intramolecular OH stretching center frequency and the Spectral Distance (SD). Although the two different approaches are simple, both the analyses furnish the same results confirming that trehalose water mixture has a higher thermal restraint with respect to the sucrose-water mixture.
The agreement between the results obtained by the two different approaches provides coherent information on the thermal stability of the disaccharide water mixtures investigated.
ETHICS APPROVAL AND CONSENT TO PARTICIPATE
Not applicable.
HUMAN AND ANIMAL RIGHTS
No animals/humans were used for studies that are the basis of this research.
CONSENT FOR PUBLICATION
Not applicable.
CONFLICT OF INTEREST
The authors declare no conflict of interest, financial or otherwise.
ACKNOWLEDGEMENTS
Declared none.

