All published articles of this journal are available on ScienceDirect.
Evaluation of the Physico-chemical and Biological Properties of Fermented Nipa (Nypa fruticans) Sap Under Closed and Open Vessel Fermentation System for Bioethanol Production
Abstract
Background
The potential of Nipa (Nypa fruticans) sap in the Cagayan Region, Philippines, for bioethanol production remains largely underexplored despite its vast expanse.
Methods
This study investigates the key physico-chemical properties of Nipa sap from Aparri, Cagayan, with a focus on fermentation dynamics and storage conditions to optimize ethanol production. Two fermentation treatments closed and open vessel conditions, were compared to determine the optimal conditions for maximum ethanol yield. Over a 7-day fermentation period, the acetic acid production, yeast activity, sugar content, and ethanol concentration of closed vessel fermented sap (CVFS) and open vessel fermented sap (OVFS) were monitored.
Results
CVFS demonstrated a higher ethanol yield (7.56%v/v at peak day), characterized by minimized acetic acid accumulation and stable yeast activity. In contrast, OVFS exhibited significant fluctuations in acetic acid and ethanol levels, indicating a lower fermentation efficiency.
Conclusion
The presence of methanol and high acetic acid content in open-vessel fermentation systems highlights the importance of fermentation conditions to prevent impurities. This study provides valuable insights into optimizing ethanol production from fermenting Nipa sap by employing closed vessel fermentation, which is crucial for sustainable bioethanol production in the Cagayan region.
1. INTRODUCTION
Nypa fruticans Wurmb or Nipa palm, is a palm species thriving in mangrove ecosystems. It is a unique and ancient palm with a distinctive structure featuring an underground horizontal stem that branches dichotomously [1]. This ecologically significant species is widely distributed across Southeast Asia [2]. Unlike typical palms like the oil palm and coconut, the nipa palm flourishes in estuaries and brackish water environments where saltwater and freshwater intermingle. These monoecious palms possess distinct characteristics, such as the absence of an upright stem or trunk, and they reach a height of approximately 1 meter before producing their inflorescence [3].
Nipa palms are currently cultivated naturally and on plantations throughout Asia. In Indonesia, the world's largest natural nipa stands to encompass approximately 700,000 hectares, while in Papua New Guinea, they cover 500,000 hectares. The Philippines boasts 8,000 hectares, and Malaysia has 20,000 hectares dedicated to nipa cultivation. Given their abundance, rural communities have started planting Nipa palms for various purposes, including the production of toddy, vinegar, and sugar derived from the sap. While there is interest in utilizing this resource to produce alcohol fuel, its full potential has not been fully realized yet [4].
According to Tamunaidu and Saka [5], the chemical composition of nipa sap consists of small quantities of organic and inorganic compounds, sucrose, glucose, and fructose, which are naturally fermented to produce ethanol. Nipa palm shows significant potential as a sustainable feedstock for bioethanol production, surpassing other fuel crops in the country [6, 7]. It can yield 20 tons of sap per hectare, which can be converted into 14,000 liters of ethanol. This quantity is more than twice the amount of cane sugar juice produced, and the sap contains valuable nutrients and fermentable carbohydrates [8]. Nipa palm emerges as the top choice among fuel crops in the country for bioethanol production, surpassing options such as sugarcane and sweet sorghum due to its consistent sap production, low land and water needs, minimal upkeep, and suitability for agroforestry practices [7]. Furthermore, the utilization of Nipa sap for bioethanol production accounts for a production cost of Php 2354 to Php 2254 per liter. With the price of the raw material (nipa sap) ranging from Php 1.25 to Php 2.50 per liter, a profit margin ranging from Php 0.75 to Php 17.72 per liter can be achieved when the alcohol yield reaches a minimum of 7% [6].
Additionally, nipa sap's sugar content is a fundamental factor in determining ethanol yield. The fresh nipa sap exhibits a lower ethanol yield compared to the fermented sap, as highlighted in the study by Radi et al. [9]. This discrepancy can be attributed to the fact that the fresh sap has not undergone complete fermentation, as evident by its elevated sugar content [10]. Hence, examining the correlation between sugar content and ethanol yield will enable us to ascertain the optimal sap quality necessary for maximizing conversion to ethanol.
The pH and acidity levels of nipa sap also drastically influence ethanol fermentation. Yeast fermentation usually thrives within a specific pH range, and intense pH values or high acidity can restrict the yeast's growth, leading to reduced ethanol yield. Acetic acid acts as a fermentation inhibitor and can impair the performance of the microorganisms involved in ethanol production. This inhibition can lead to a decrease in the rate of fermentation and the overall yield of bioethanol [11]. Studying the effect of pH and acidity on ethanol production will assist in setting up the right conditions for yeast fermentation. Moreover, contaminants in nipa sap can avert fermentation and impact ethanol yield [12]. Natural acids, phenols, and microbial contaminants can inhibit yeast growth and compromise fermentation efficiency [13].
This study will further evaluate the properties of nipa sap, particularly the sap harvested from Cagayan. Primarily, the study aims to evaluate the changes in the physicochemical and biological properties of Nipa sap under closed and open vessel fermentation systems, aiming to identify the optimal condition for maximizing ethanol yield.
The Cagayan region boasts an extensive expanse of nipa stands spanning 3,704 hectares, making it the largest area at the provincial level. Fig. (1) shows the location of Nipa Strands in Region 2. Particularly, Aparri, Cagayan has a total area of 1316.494758 ha with Nipa strands [14]. With the vast land area of nipa strands, the nipa strands haven't been fully utilized for the production of bioethanol. The objective of this study is to investigate the key properties of nipa sap collected in Aparri Cagayan. Additionally, the study aims to identify the fermentation conditions and time at which optimum conversion efficiency is attained to achieve the highest ethanol concentration before distillation. This study is crucial for achieving the best possible quality and high-yield ethanol production.
2. MATERIALS AND METHODS
2.1. Collection of Samples
Fresh nipa sap was collected from previously tapped nipa palms in Barangay Navaggan, Aparri, Cagayan at 18° 22' North and 121° 34' East (Fig. 1). The nipa palm was tapped at 6 PM and harvested 12 hours later. Note that in this study, fresh nipa sap is defined as nipa sap collected 12 hours later after tapping. Nipa sap from three palms in three different sites was tagged as Peduncle 1, Peduncle 2, and Peduncle 3. Nipa sap was collected in a closed collection vessel adapted from Madigal et al. [10] revised and inverted with a plastic cap. Then, the collected sap was poured and distributed into a sterilized squeeze bottle with designated days of fermentation per bottle, stored at 5°C, and transported for 4 hours to the Mariano Marcos State University-National Bioenergy Research and Innovation Center laboratory for analysis. The peduncle sources for the collection of nipa sap were selected randomly. Nipa sap collected from three different peduncles was tagged as FNS1 (Fresh Nipa Sap collected from peduncle 1), FNS2 (Fresh Nipa Sap collected from peduncle 2), and FNS3 (Fresh Nipa Sap collected from peduncle 3).
2.2. Fermentation of Sample
Two treatments were prepared in improvised closed and open vessel fermentation systems. For the closed vessel fermented sap (CVFS), the nipa sap sample was stored in closed and sealed bottle containers that provided a controlled and isolated environment for fermenting sap. These vessels were equipped with airlocks to allow gases to escape while keeping air out, resulting in the absence of oxygen, allowing anaerobic fermentation.
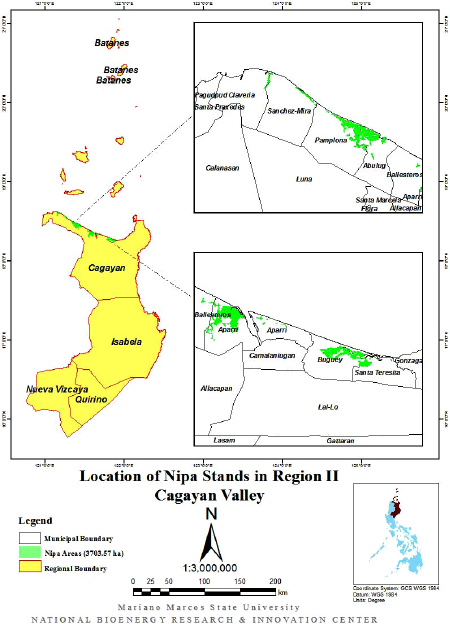
Location of Nipa Strands in Aparri, Cagayan (Pastor et al, 2022) [14].
Meanwhile, open fermentation vessels were left uncovered during fermentation. This allowed for natural airflow and exposure to oxygen present in the air at ambient conditions.
Both nipa sap in the open and closed vessels were left to naturally ferment for 7 days at ambient temperature.
Bottle tags included CVFS for closed vessel fermented sap and OVFS for open vessel fermented sap. The number after the letter corresponds to the tagged peduncle where the sap was collected.
Aliquots from FNS1, FNS2, and FNS3 were used, transferred to treatment bottles, labeled, and employed non-destructive sampling. Treatments were labeled for closed vessel fermentation: CVFS1, CVFS2, CVFS3, and open vessel fermentation: OVFS1, OVFS2, OVFS3.
2.3. Determination of pH, Relative Density, Viscosity, and Total Solids of Nipa Sap
The pH of nipa sap was measured using ASTM E70-07 through an ion-selective electrode. The Oakton Ion700 pH meter was calibrated using standard buffer solutions before measurement.
The relative density of the nipa sap was obtained using a patterned method from AOAC 932.14 with a calibrated 20 mL glass Pyrex pycnometer.
The viscosity of fresh sap was determined using a Brookfield viscometer with a standard Spindle RV-5 torque coefficient of 1 and a speed of 100 rpm.
APHA Standard Method 2540B was used in the determination of total solids dried at 103-105°C. An evaporating dish was initially dried, with its tared weight recorded post-drying in either an oven or through ignition in a muffle furnace. Subsequently, before being carefully transferred into the pre-weighed dish, the sample was acclimatized to room temperature, ensuring the dried residue fell within the range of 2.5 to 200 mg. The sample underwent evaporation to eliminate free-standing water at 80°C, followed by thorough drying in a convection oven set at 103-105°C for a minimum of 60 minutes. The dish was weighed, and its weight was duly recorded after cooling. The drying cycle was then iterated until a consistent weight change of ≤0.5 mg manifested between successive weighing.
2.4. Elemental Analysis of Nipa Sap
In this study, the inorganic elements in the nipa sap, including Potassium, Sodium, Copper, and Manganese, were quantified using standard methods adapted from ASTM D1127, ASTM D1688, and ASTM D82-07. Calibration curves were prepared, after following the specified procedures outlined in these standards. Elemental analysis was conducted using a Perkin Elmer Atomic Absorption Spectrophotometer PinAAcle 900H equipped with a cathode lamp specifically for the targeted elements. The equipment utilized acetylene as fuel and compressed air as oxidant.
2.5. Quantification of Specific Sugar
Sugar was quantified using HPLC (Perkin Elmer), an Epic Amine HD column (4.6 × 150 mm, 5 μm size) and a Shodex RI-501EX detector. The ratio of the mobile phase was 75:25, a combination of acetonitrile and water, running at 1 mL/min with an injection volume of 15 μL. Sample solutions were diluted with distilled water prior to HPLC analysis. The diluted samples were filtered through a 0.45-μm syringe filter (nylon) to eliminate particles prior to injection. Standard curves were created for sucrose, d-glucose, d-fructose and maltose at different concentrations (0.5%w/w-2%w/w). Utilizing linear regression analysis with standards, a calibration curve was constructed to determine concentration through peak area.
2.6. Determination of Components of Fresh and Fermented Nipa Sap (in Closed and Open Vessel Fermentation System)
The components of nipa evaluated in this study are as follows: total yeast count, pH, total soluble sugar, titratable acidity in terms of acetic acid, ethanol and methanol content.
Changes in daily physical-chemical properties of closed and open vessel fermented nipa (Nypa fruticans) sap were assessed by evaluating the total yeast count and total soluble sugar in a 7-day period.
The yeast count was determined using the APHA Method 9215 C. Spread Plate Method. Materials were sterilized with a holding time of 15 mins at 121°C using HICLAVE HV-10 Autoclave. Five samples, both closed and open vessel fermented sap, were prepared in triplicate. The samples were serially diluted with sterile water and spread onto Rose Bengal with chloramphenicol agar on replicated plates.
The titratable acidity of the sample was assessed by titrating the filtered sap with 0.01 N NaOH, employing a few drops of 1% phenolphthalein solution, which served as an indicator. The resulting value was then calculated as titratable acidity and expressed in terms of acetic acid.
The total soluble solids content was assessed employing AOAC Official Method 932.14, which utilizes a refractometer for determining solids in syrup. A calibrated refractometer with automatic temperature compensation (ATC) purchased from YAGO Technology was employed for this purpose. To ensure accuracy, the instrument was calibrated using distilled water, initially setting it to zero and then adjusting it to the reference point. The refractive index of the fresh nipa sap was subsequently measured and expressed in degrees Brix.
The ethanol content of nipa sap was determined using a Perkin Elmer Claurus 590 Gas Chromatograph equipped with Flame Ionization Detector. An Elite Wax capillary column (50 m x 0.32 mm x 1.0 μm) was used to separate the eluting compounds. Calibration standards of methanol and ethanol (HPLC grade) were used. Input conditions to the equipment are as follows: inlet Temp of 300 °C, hydrogen carrier gas linear velocity of 20 mL/min, split ratio of 9.2:1, injection volume of 1 μL injection, initial oven temperature of 20 °C and FID Temp of 150 °C, air flow of 45 mL/min and H2 flow of 45 mL/min. Precision was investigated with five injections of the sample.
The physical and chemical changes in the character- istics of the sample fermented in a closed vessel were compared with the sample fermented in an open vessel. The experiments in this study were conducted using a completely randomized design (CRD), with analysis performed in three replicates unless otherwise specified. Mean and standard deviation (SD) calculations were done for each characteristic, and the findings were reported in these formats. Statistical analyses were performed using the Statistical Tool for Agricultural Research (STAR) v2.0.1 software, which included one-way analysis of variance (ANOVA). In all data analyses, P-values of 0.05 or below were used to determine significance.
3. RESULTS AND DISCUSSION
Physical and Chemical Properties of Fresh Nipa Sap
Physico-chemical properties of the collected nipa sap include pH, density, viscosity, appearance, total specific sugar, total soluble sugar, total reducing sugar, total solids, titratable acidity expressed as acetic acid and elemental analysis (Mn, Cu, K, Na). For fresh nipa sap, an on-site analysis was done. The physical appearance of FNS1 and FNS2 can be described clear while FNS3 appeared to be slightly milky as compared to the observation of Tamunaidu and Saka [15] for fresh nipa sap. Radi et al. (2013) [9] stated the yellowish translucent color of Nipa sap is a sign of its high quality and freshness. Within 24 hours, the originally transparent fresh nipa sap became cloudy, concomitantly giving rise to white precipitates (Fig. 2) [15].
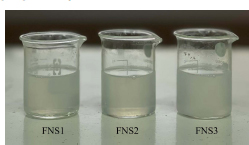
The physical appearance (visual) of fresh nipa sap.
Quantification of sugar in an HPLC equipped with a refractive index detector revealed the presence of glucose, sucrose, and fructose in the fresh nipa sap (Fig. 3). This is similar to the finding corroborated by Tamunaidu and Saka [16].
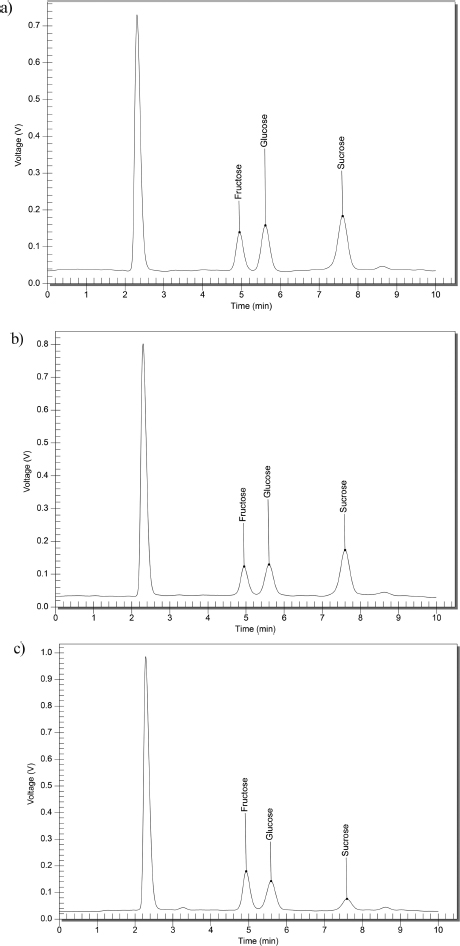
Chromatograph of specific sugar content of (a) FNS1 (b) FNS2 and (c) FNS3.
The sugar composition of nipa sap from Aparri, Cagayan, is presented in Table 1. Three samples, FNS1, FNS2, and FNS3, had their glucose, sucrose, fructose, and maltose concentrations (%w/w) recorded. Notably, the samples differ in the amount of glucose, FNS3 has the highest quantity at 5.57%w/w, while FNS1 has the lowest at 4.33%w/w. On the other hand, sucrose in the different samples ranges from 1.11 to 7.10%w/w and is impressively the highest among the types of sugars present in FNS1 and FNS2. Along with other studies by Tamunaidu (11.1%), Prasetyu (12.74%) Nguyen 2016 (7.31%) [16-18], all conclude a high sucrose content among the other sugars present. The elevated sucrose concentration can be attributed to the nipa palm inflorescence portion, which serves as a primary storage site for sucrose. Research on coconut palm has found that this plant segment normally stores about half of all carbohydrates, primarily in the form of sucrose [19]. In FNS3, it can be observed that the glucose content is higher compared to sucrose because fresh nipa saps readily undergo hydrolysis post-collection, converting sucrose into glucose and fructose [15].
Fructose, another important monosaccharide, is also present but varies slightly between samples. Maltose is not detected in all samples. The total sugars present in FNS1 and FNS2, 15.96, and 15.42, respectively, fall in the ranges of nipa sap sugar content (13.13%-16.98%) from different sites in East Java, Indonesia, Malaysia, and Thailand as compared by Prasetyu [17]. The content of sugar can differ throughout locations due to factors such as climate, tapping techniques, and environmental circumstances [4, 20].
From the physical and chemical properties presented in Table 2, it's evident that FNS2 generally exhibits higher acidity, as indicated by its lowest pH value (4.24) and the highest titratable acidity (3.19 g/L) compared to FNS1 and FNS3. Additionally, FNS2 showcases higher total solids (887.27 g/L) than FNS1 and FNS3, suggesting a potentially denser composition. However, FNS1 stands out with the highest volume collected (12 hours before tapping) from the peduncle (1.20 L), the highest relative density (1063.07 g/L), and the highest total soluble sugar content (16oBrix), indicating richer properties in terms of volume, concentration, and sugar content. Furthermore, both FNS2 and FNS3 exhibit identical viscosity (24 MPa-s), distinguishing them from FNS1, which has a lower viscosity (20 MPa-s). This comparison highlights the distinct attributes and variations among the samples, providing insights into their compositions. The physicochemical characteristics observed in nipa sap samples are impacted by the location's geographical proximity to bodies of water [10].
| Specific Sugar Content | |||
|---|---|---|---|
| - | FNS1 | FNS2 | FNS3 |
| Glucose, %w/w | 4.33±0.15 | 5.37±0.03 | 5.52±0.30 |
| Sucrose, %w/w | 6.79±0.12 | 7.10±0.36 | 1.11±0.21 |
| Fructose, %w/w | 4.84±0.05 | 2.95±0.37 | 4.95±0.29 |
| Maltose, %w/w | nd* | nd* | nd* |
| Total Sugar | 15.96 | 15.42 | 12.66 |
| Parameters | Sample | ||
|---|---|---|---|
| - | FNS1 | FNS2 | FNS3 |
| Volume collected from the peduncle, L | 1.20 ± 0.00 | 0.80 ± 0.00 | 1.00 ± 0.00 |
| pH | 4.60±0.01 | 4.24±0.00 | 4.26±0.01 |
| Relative density, g/L | 1063.07 ± 0.46 | 1062.80 ± 0.00 | 1059.73 ±0.23 |
| Viscosity, mPa-s | 20.00±0.00 | 24±0.00 | 24±0.00 |
| Titratable Acidity expressed as acetic acid, g/L | 2.57±0.01 | 3.19±0.01 | 2.37±0.03 |
| Total Solids | 885.07±0.05 | 887.27±0.03 | 875.35±0.01 |
| Total Soluble Sugar, oBrix | 16±0.00 | 15±0.00 | 12±0.00 |
| Inorganic Elements | |||
| Sodium, g/L | 5.76±0.25 | 1.22±0.02 | 5.24±0.12 |
| Potassium, g/L | 0.43±0.01 | 0.30±0.00 | 0.45±0.07 |
| Copper, g/L | 8.49X10⁻⁴ ±0.00 | 3.65X10⁻⁴±0.00 | 8.47 X10⁻⁴±0.00 |
| Manganese, g/L | 1.11 X10⁻⁴±0.00 | 4.24X10⁻⁵±0.00 | 2.43X10⁻⁵±0.00 |
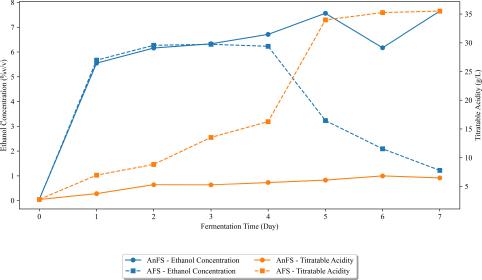
Changes in titratable acidity (expressed as acetic acid) and ethanol concentration of nipa sap during closed and open vessel fermentation over time.
The inorganic elements present in nipa sap (Table 2) reveal notable differences across the samples FNS1, FNS2, and FNS3. FNS1 demonstrates significantly higher concentrations of sodium (5.76 g/L), potassium (0.43 g/L), copper (8.49 x 10⁻⁴ g/L), and manganese (1.11 x 10⁻⁴ g/L) compared to FNS2 and FNS3. FNS3 exhibits slightly lower sodium (5.24 g/L) and potassium (0.45 g/L) concentrations than FNS1 but still higher than FNS2. However, FNS2 consistently displays the lowest concentrations of sodium (1.22 g/L), potassium (0.30 g/L), copper (3.65 x 10⁻⁴ g/L), and manganese (4.24 x 10⁻⁵ g/L) among the samples.
3.1. Evaluation of Changes in Physico-chemical properties of Fermented Nipa Sap
The changes in physico-chemical properties of nipa sap collected from Aparri, Cagayan were noted in this study. Two fermentation treatments were used to determine the optimum storage time of the nipa sap before proceeding to distillation. To optimize ethanol concentration, which is essential for maximizing ethanol production during distillation, it is crucial to determine the conditions that can obtain the highest fermentation efficiency [21].
The data presented as CVFS and OVFS in Figs. (4-6) were obtained from the average of the three aliquots (CVFS1, CVFS2, CVFS3), (OVFS1, OVFS2, OVFS3). Natural fermentation was carried out at an ambient temperature (25oC).
The presence of acetic acid in fermented nipa sap suggests the presence of acetic acid bacteria, including species like Acetobacter. Moreover, naturally occurring yeasts and bacteria gradually ferment the sugars present in nipa sap, leading to the production of ethanol, lactic acid, and/or acetic acid [22]. In Fig. (4), the titratable acidity of Aparri, Cagayan nipa sap was expressed as acetic acid. It can be observed in the figure that during closed vessel fermentation, the acetic acid of CVFS increased over time but not gradually, whereas compared to nipa sap fermented in an open vessel (OVFS), it increased significantly from day 0 up until day 7. Acetic acid of OVFS started peaking at day 5 (33983.40 g/L) until it continuously went up to 35520.99 g/L on day 7, whereas CVFS started peaking at day 6 (6837.21 g/L) and no sudden changes were incurred throughout. It can be observed in the graph that closed vessel fermentation minimizes the increase in acetic acid. Therefore, it can be noted that fermentation condition affects the acetic acid production significantly. The elevation in acetic acid levels during the fermentation process of nipa sap stems from the oxidation of ethanol by aerobic bacteria or acetic acid bacteria [18, 23]. Aerobic bacteria are well-known for their role in vinegar production as they perform specific oxidation reactions through oxidative fermentation, channeling released electrons to molecular oxygen [24]. In the OVFS, the fermentation simulated the oxygen in the air at its continuous phase due to the open-air condition [25]. As seen in Fig. (4), as the acetic acid of OVFS started its gradual increase from Day 4 to Day 5, the ethanol content also started decreasing (from Day 4 to Day 5). The presence of acetic acid therefore deteriorates the quality of the fermented nipa sap in terms of ethanol content which may result in lower ethanol yield when subjected to distillation.
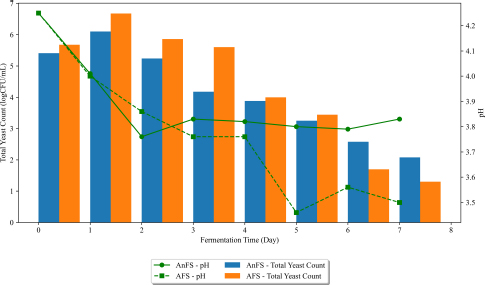
Changes in pH and total yeast count of nipa sap during closed and open vessel fermentation over time.
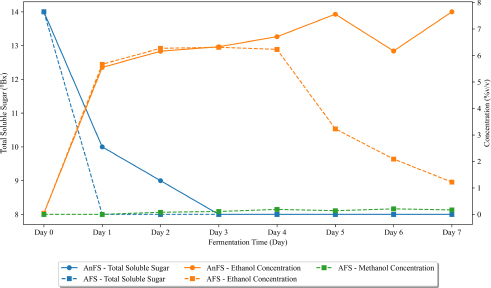
Changes in sugar, ethanol, and methanol concentration of nipa sap during closed and open vessel fermentation over time.
The performance of yeasts during alcoholic fermentation is influenced by various stressful conditions imposed by fermentation processes [26]. Fig. (5) shows total yeast count (TYC) changes of Aparri, Cagayan nipa sap over 7 days. CVFS and OVFS’s total yeast count showed similar trends. It can be observed that the TYC had an upward trend from day 0 to day 1. This is comparable to a study conducted by Madigal et al. [27], where Saccharomyces cerevisiae was isolated in a different town in the Cagayan province. The S. cerevisiae yeast maintained dominance exclusively during the initial 24 to 48 hours of alcohol fermentation, aligning closely with the findings documented by Romano et al. [28]. However, as the fermentation progressed beyond the 48-hour threshold, Madrigal et al. noted a notable accumulation of toxic metabolic by-products, depletion of essential nutrients, and acidification of the fermentation environment. This observation was also noted in this study, with changes in pH in both CVFS and OVFS decreasing. The later phases of the open vessel fermentation of nipa sap (OVFS) noted inconsistencies in pH, which might have triggered the proliferation of other microorganisms and various uncultured fungi [27].
Increased ethanol concentrations during fermentation resulted in reduced yeast isolate colony sizes because of dissipated cellular pH gradients, culminating in irreversible protein denaturation and decreased microbial activity (Figs. 4 and 5). Furthermore, this process hinders the growth and viability of microorganisms until they reach their optimal level [25, 26, 29]. Changes in pH are higher in OVFS compared to CVFS. Lower pH was observed in OVFS, which attributed to the increasing acetic acid content predominant in the open vessel fermentation of nipa sap.
The total soluble solid content of the sap is commonly assessed based on its sugar concentration, which essentially reflects the overall sugar content. The validity of employing brix measurements for on-site determination of total sugar content in nipa saps is suggested by the notable correlation observed between brix measurements and total sugars, as verified by HPLC analysis [15].
In Fig. (6), it can be observed that the average sugar content of Nipa sap fermented in a closed vessel (CVFS) gradually decreased its total soluble sugar from day 0 to day 3 with a 14oBrix to 8oBrix sugar content until it became constant up to day 7. The decrease in sugar levels strongly suggests substantial fermentation, especially during the early storage period [22]. On the other hand, the nipa sap fermented in open vessel (OVFS) had an abrupt decrease in sugar content (14oBrix to 8 oBrix) from day 1 to day 0, then remained constantly the same throughout day 7. OVFS attained a constant sugar content two days earlier than CVFS. The content of the carbohydrate feedstock, such as sucrose and glucose, affects the fermentation kinetics [30].
The presence of ethanol on day 0 or in freshly tapped nipa sap can be attributed to the naturally occurring yeast present in the sap [23]. Over a 7-day fermentation period, the ethanol content of CVFS exhibited a gradual increase. Following the onset of fermentation, an ethanol concentration of 5.55%v/v was attained after just 1 day. Subsequently, a stable ethanol concentration persisted until day 3, followed by a noticeable escalation on day 4 (6.71%v/v), reaching its peak on day 5 (7.56%v/v). CVFS demonstrated slight downward fluctuations in ethanol content on its 6th day of fermentation. Conversely, OVFS experienced a marked surge in ethanol content from day 0 (0.04%v/v) to day 1 (5.67%v/v), marginally surpassing CVFS's initial concentration. Notably, these abrupt changes in ethanol content correlated with fluctuations in sugar content. By day 5 of fermentation, the ethanol content in OVFS markedly decreased to 3.23%v/v from the 6.23%v/v observed on day 4. This downward trend persisted until day 7, indicating a decrease in fermentation efficiency starting from day 4 for OVFS. In Fig. (6), it is evident that CVFS exhibited a peak in ethanol content on the same day that OVFS experienced a sudden decrease in ethanol levels.
Surprisingly, a minimal amount of methanol was detected in OVFS starting from Day 2 (0.08%v/v) and peaking at Day 6 (0.21%v/v). From this data, it is evident that methanol is present when nipa sap is fermented in an open vessel. The presence of methanol in nipa sap may be due to microbial dominance in nipa sap correlated with the observed biochemical changes during its fermentation [31]. In addition, methanol may be present in some parts of the Nipa palm as Reza et al. confirmed the presence of methanol extract in Nipa leaves [32].
Table 3 presents the daily changes in sugar content, titratable acidity (expressed as acetic acid), methanol concentration, and ethanol concentration during the fermentation process of nipa sap under both closed and open vessel fermentation system. Notably, a substantial reduction in sugar content is observed within the initial 24 hours. Furthermore, significant variations in acetic acid were noticeable from day 1 to day 7, except day 3. Methanol remains undetectable in the closed vessel fermented nipa sap (CVFS). Meanwhile, the ethanol concentration exhibited a markedly higher level when fermentation occurs under closed vessel conditions. Significant differences in the actual ethanol yield emerged from day 5 onward.
Table 4 summarizes the varying ethanol yields from the fermentation of nipa sap and other feedstocks, as studied by Tamunaidu et al. (2013) and Puangpee (2016). The ethanol content of nipa sap from Cagayan, Philippines, ranged from 5.5% to 7.65% v/v, which is higher than the ethanol content of fermented sap, fermented sugarcane, and fermented sucrose presented in Tamunaidu et al.'s study. As discussed in the study of Mateo et al. (2023), a high ethanol yield was achieved at the Arinabo facility in Pamplona, Cagayan, with an alcohol yield of 7% v/v when the sap was stored in closed conditions that prevented aerobic fermentation [6].
Extracted sap from nipa palm can yield between 0.5 to 2.0 liters of sap per day. This sap can then be converted into bioethanol, resulting in a production range of 20.45 to 136.65 liters of bioethanol per hectare per day. In Pamplona, Cagayan, according to Mateo et al. (2023), nipa sap collection can reach up to 800 liters of sap per hectare. If Aparri, Cagayan, has a total nipa strands area of 1,316.494758 hectares, then approximately 1,053,195.8 liters of nipa sap can be collected, potentially producing about 57,925 to 80,569 liters of nipa bioethanol.
| - | DAY 0 | DAY 1 | DAY 2 | DAY 3 | DAY 4 | DAY 5 | DAY 6 | DAY 7 |
|---|---|---|---|---|---|---|---|---|
| Total Soluble Sugar, oBrix | ||||||||
| CVFS | 14±2.08a | 10±3.06a | 9±1.53a | 8±1.15a | 8±1.00a | 8±0.58a | 8±0.58a | 8±0.58a |
| OVFS | 14±2.08a | 8±0.58a | 8±1.00a | 8±0.58a | 8±0.58a | 8±0.58a | 8±0.58a | 8±0.58a |
| Titratable Acidity expressed as Acetic Acid, g/L | ||||||||
| CVFS | 2.71±0.41a | 3.73±0.91b | 5.29±1.50b | 5.27±1.73 a | 5.68±1.91b | 6.11±1.70b | 6.84±1.82b | 6.49±1.64b |
| OVFS | 2.71±0.41a | 6.97±1.45a | 88.39±1.41a | 13.53±5.63a | 16.27±1.21a | 33.98±7.33a | 35.25±7.49a | 35.52±2.83a |
| Methanol Concentration, %v/v | ||||||||
| CVFS | 0±0.00a | 0±0.00a | 0±0.00b | 0±0.00b | 0±0.00b | 0±0.00b | 0±0.00b | 0±0.00b |
| OVFS | 0±0.00a | 0±0.00a | 0.08±0.04a | 0.11±0.03a | 0.19±0.04a | 0.14±0.14a | 0.21±0.14a | 0.17±0.12a |
| Ethanol Concentration, %v/v | ||||||||
| CVFS | 0.04±0.08a | 5.55±2.17a | 6.16±0.67a | 6.33±0.47a | 6.71±0.69a | 7.56±0.60a | 7.43±0.44a | 7.65±0.45a |
| OVFS | 0.04±0.08a | 5.67±1.00a | 6.27±0.96a | 6.31±1.69a | 6.23±1.30a | 3.23±2.45b | 2.09±2.69b | 1.22±1.35b |
superscript are not significantly different (p≤0.05).
| Feedstock | Ethanol Content, %v/v |
|---|---|
| Nipa sap from Southern Thailand | 2.36-4.87 |
| Sugarcane | 4.44 |
| Sucrose | 0.03 |
CONCLUSION
In this study, we explored the physico-chemical and biological changes occurring in nipa sap during fermentation, with a focus on optimizing storage conditions for ethanol production prior to distillation. Our findings reveal that closed vessel fermentation system outperforms open vessel fermentation system in terms of fermentation efficiency, leading to higher ethanol concentrations. The presence of methanol is particularly evident in open vessel fermentation systems. Moreover, the rise in acetic acid levels during open vessel fermentation highlights the impact of microbial activity, potentially compromising ethanol yield during distillation. Our results suggest fermenting nipa sap under closed vessel condition to obtain optimum ethanol content and minimize methanol contamination as well as acetic acid, thus enhancing its suitability for bioethanol production. Additionally, this study recommends exploring the presence of other organic acids and investigating acid-producing bacteria such as lactic acid and acetic acid bacteria which contribute to the increase in acidity of the nipa sap.
AUTHORS’ CONTRIBUTION
It is hereby acknowledged that all authors have accepted responsibility for the manuscript's content and consented to its submission. They have meticulously reviewed all results and unanimously approved the final version of the manuscript.
LIST OF ABBREVIATIONS
| FNS | = Fresh Nipa Sap |
| CVFS | = Closed Vessel Fermented Sap |
| OVFS | = Open Vessel Fermented Sap |
AVAILABILITY OF DATA AND MATERIALS
The data and supportive information are available within the article.
FUNDING
This study has been funded by Mariano Marcos State University-National Bioenergy Research and Innovation Center (MMSU-NBERIC) through the General Appropriations Act Fund 101 under grant number NBERIC2024-PR3-01-02.
ACKNOWLEDGEMENTS
Completing this study would not have been possible without the generous contributions of those who willingly shared their time, knowledge, resources, expertise, experiences, and advice. The authors would like to acknowledge the following:
The former director of MMSU-NBERIC, Dr. Roque A. Ulep for initiating the idea to conduct this research.
The present director of MMSU-NBERIC, Dr. Bjorn S. Santos for his unwavering support during the conduct of this research.
We also extend our sincere appreciation to Mariano Marcos State University - National Bioenergy Research and Innovation Center and Engr. Psalm David Pastor for assisting in essential parts of our research.

