All published articles of this journal are available on ScienceDirect.

Determination of the Water use Efficiency of a Pecan Nut Orchard based on the Irrigation Scheduling and the Evapotranspiration Rate in Northern Mexico
Authors Info & Affiliations
Abstract
Background:
Adult pecan trees require a significant water supply for high yields and nut quality. Pecan nut orchards are established in semi-arid regions where water is the primary limiting resource for agriculture. Therefore, in these regions, improving water use efficiency is essential.
Objective:
Evaluate the water use efficiency of a pecan tree orchard based on the comparison of irrigation scheduling with the evapotranspiration rate data.
Methods:
The study was conducted in a pecan nut (Carya illinoinensis) orchard of 7.2 ha with 7-year-old Western and Wichita cv tress. The volume of water applied to each tree (drip irrigation) was converted to a daily irrigation depth and compared against the daily rate of actual (measured with an Eddy covariance system) and the FAO Penman-Monteith evapotranspiration.
Results:
Comparing the monthly water depth applied to each tree against the monthly FAO-Penman Monteith ET, surplus or deficit irrigation episodes were detected. Because the canopy trees only covered 18.7% of the orchard area, the daily rate of actual evapotranspiration during the months of the trees growing was very small (1 to 2 mm) compared with the orchards of mature pecan trees. The corresponding monthly crop coefficients (Kc) were also small (0.315 on average).
Conclusion:
This study showed that by comparing the rate of ETref against the irrigation depth applied to the trees in the irrigation scheduling, it is possible to reveal cases of surplus or deficit of water supplied to a pecan nut orchard.
1. INTRODUCTION
The United States and Mexico are the countries with the highest production of pecan nuts (Carya illinoinensis), with 45% and 39%, respectively [1]. In Mexico, 146,239 hectares were cultivated in 2020 and the states of Chihuahua, Coahuila, Sonora, Durango, and Nuevo Leon accounted for 60.9%, 14.9%, 13.34%, 5.2%, and 2.9% of the total production, respectively [2]. These states are in the semi-arid and arid zones of the country, where water is the primary limiting resource for agriculture. The water scarcity in these regions may cause water rights disputes among urban, industrial, and agricultural users [3]. It is necessary to improve the efficiency of water use because the agriculture sector is responsible for the highest consumption. Due to the significant foliar development of the trees, pecan nut orchards have high water requirements. Studies carried out in the coastal regions of Hermosillo, Sonora, Mexico, and Arizona USA demonstrated that pecan nut orchards have evaporation rates of up to 1,234 mm per year [4]. Other studies indicated that the daily rate of evapotranspiration in pecan nut orchards in northern Mexico could reach up to 6 mm [5].
The daily water requirement for a walnut tree depends on its age and the stage of growth it is in. In the dormant season, an adult tree with a crown of 12 m in diameter requires 50 L/d, in the budding phase 600 L/d, at the beginning of the fruit growth 1000 L/d, and for the filling of fruits 1200 L/d [6-8]. The irrigation systems used in the pecan nut orchards of northern Mexico may include surface irrigation, sprinkler irrigation, and drip irrigation. Drip irrigation has the potential to be the most efficient system and uses less water because the comparatively smaller wetting area reduces losses due to soil surface evaporation [9, 10]. Drip irrigation with buried tape could be the most efficient system because most of the applied irrigation volume is consumed by the transpiration of tree leaves, and only a small volume can evaporate from the soil surface.
The growers apply irrigation at a specific frequency, applying the same volume of water, and they do not consider the daily rate of evapotranspiration of the orchard trees, which can result in an irrigation schedule with a water deficit or excess water since the water consumption of the orchard trees depends on their growth stage, daily weather variations, and the soil water content. Since pecan nut production occurs in semi-arid regions where water is the primary limiting resource for agriculture, it is essential to improve water use. Therefore, applying the water at the appropriate time and in the required volume is crucial for improving the water use efficiency in pecan nut orchards. The objective of this study was to evaluate the water use efficiency of a pecan tree orchard based on the comparison of irrigation scheduling with the rate of evapotranspiration data.
2. MATERIALS AND METHODS
2.1. Study Site Location
The study was carried out in a pecan tree orchard (Carya illinoinensis) in the “Los Gachupines” property, located in the municipality of General Cepeda (25° 47' N, 101° 45' W, with an altitude of 1304 masl) of Northern Mexico, during the production cycle from March to October 2017. The local climate is dry and temperate. The average annual temperature is 18 to 20 °C, and the average annual rainfall is 300 to 400 mm. The prevailing winds are from the southwest with speeds of 8 to 15 km/h [11]. The site of the study was an area of 7.2 ha, with 7-year-old walnut trees of the Western and Wichita cultivars. There was one row of Wichita trees as pollinators per eight rows of Western trees. The trees were aligned in the north-south direction, with 8 m of space between trees and 12 m of space between rows (104 trees ha-1). The trees had an average height of 4 m and an average crown diameter of 4.78 m. The orchard was irrigated with a drip system, with tapes buried at a depth of 0.20 m at one meter from each side of the trees’ trunks. There were 16 emitters per tree (8 on each side) with a spacing of 60 cm and a flow rate of 1.68 LPH. Two 12-hour irrigations were applied every six days.
2.2. Instrumentation and Measurements
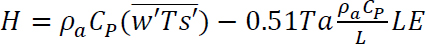
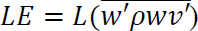
The eddy covariance method was used to measure the sensible (H) and latent (LE) heat flux between the canopy of the trees in the orchard and the atmosphere. The following equations were used [12]:
 |
(1) |
 |
(2) |
where ρa, Cp, and Ta are density, heat capacity, and air temperature, respectively; w is the vertical wind speed, Ts is the sonic temperature, L is the heat of vaporization of water, and ρwv is the density of water vapor in the air. The horizontal bar over two variables represents the covariance for a time interval (30 min); the variables with a prime symbol are deviations from the mean.
A three-dimensional sonic anemometer (CSI-CSAT3, Campbell, Scientific, Inc., Logan, Utah, USA) was used to obtain the sonic temperature (Ts) and the vertical wind speed (w). An open-path water vapor and carbon dioxide analyzer (Open Path CO2/H2O analyzer, LI-7500. LI-COR, Lincoln, Nebraska, USA) was used to find the density of water vapor in the air. The air temperature (Ta) was measured with a temperature and relative humidity sensor (HC2S3 Temperature and Relative humidity probe, Campbell, Scientific, Inc., Logan, Utah, USA). A CR1000 datalogger (Campbell, Scientific, Inc., Logan, Utah, USA) was connected to all sensors to obtain measurements at a frequency of 10 Hz and generate 30-min covariances.
The three-dimensional sonic anemometer and open-path carbon dioxide and water vapor analyzer were mounted in a tower 6 m above the soil surface (2 m above the tree canopy) and located at the center of the southern end of the study area, oriented towards the north so that the wind had at least 300 m of contact with the orchard trees in the north-south direction and 240 m in the east-west direction before they met the sensors. The Eddy Pro version 6.2.1 software was used to obtain flux corrections and sensible and latent heat flux covariances. The daily rate of evapotranspiration (8:00 h to 19:00 h) throughout the months of the trees’ growth in the orchard was obtained by integrating the latent heat flux (30 min average) and dividing by the heat of vaporization of water. The energy balance over the pecan nut orchard was calculated [10, 13] to evaluate the precision of the sensible and latent heat fluxes using the following equation:
 |
(3) |
Rn is the net radiation, and G is the soil surface heat flux. Rn was measured with two net radiometers (LITE, Keep, and Zonen, Inc., Delft, The Netherlands). One radiometer was placed 2 m above the tree canopy, the other above the ground surface in the corridor between the trees. The average Rn of the surface was obtained with the weighted average. The weighting factor was the ratio of the area covered by the tree crown and the ground area according to the orchard plantation framework.
The soil surface heat flux (G) of the orchard was obtained by the surface-weighted average between the soil surface heat flux under the tree canopy and the soil surface heat flux at the corridor between trees. At each surface, the soil heat flux was obtained by adding to the heat flux measured at 8 cm below the surface (with a heat flux transducer, model HFT3, Campbell Scientific, Inc., Logan, Utah, USA), the changes in the energy of the soil layer above each transducer due to variations in soil temperature at 2 cm and 6 cm of soil depth, measured with chromel-constantan thermocouples. These sensors were connected to another CR1000 datalogger to make measurements at a frequency of 1 Hz and store 30 min averages.
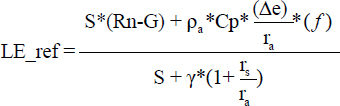
The FAO-Penman-Monteith method [10, 14] was used to determine the daily reference evapotranspiration rate of the site where the study was carried out. The following equation was used:
 |
(4) |
where LEref is the reference latent heat flux (MJ m-2 d-1), S is the slope of the function that represents the relationship between saturation vapor pressure and temperature (kPa K-1), Rn represents the net radiation over the surface (MJ m-2 d-1), G is soil surface heat flux (MJ m-2 d-1) that corresponds to 10% of the net radiation, ρa is the density of the air (kg m-3), Cp represents the heat capacity of the air (MJ kg-1 K-1), Δe is the vapor pressure deficit of the air (kPa), γ is the psychrometric constant of the place (kPa K-1), ra is the aerodynamic resistance of the air to water vapor flow (s/m), and rs is the canopy resistance to the flow of water vapor (s/m). The factor ƒ (8.64e-4) is for the unit transformation of ra from s/m to s/d.
For the reference surface that corresponds to a large area of uniform vegetation (with a 12 cm height) that completely covers the surface with no soil moisture deficit, the aerodynamic resistance is obtained with the following equation:
 |
(5) |
where u2 is the wind speed (m/s) measured at 2 m above the surface. For the same vegetation, the canopy resistance corresponds to a value of 70 s/m. Wind speed was measured with a three-dimensional sonic anemometer (3-D sonic anemometer, Campbell Sci., Logan, Utah, USA). Total incident solar radiation was measured with a silicon pyranometer (model SP-510, Apogee Inst., Logan, Utah, USA). The air vapor pressure deficit was obtained from air temperature and relative humidity, which were measured with a temperature and humidity probe (HC2S3 temperature and relative humidity probe, Campbell, Sci., Logan, Utah). Measurements were obtained at 1 s, and 30-min averages were generated.
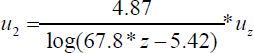
To determine the wind speed at a height of 2 m from the speed measured at a different elevation, the following equation is used:
 |
(6) |
where uz is the wind speed measured at height z.
In the FAO Penman-Monteith method, the net radiation is obtained from measurements of incident solar radiation, latitude, longitude, altitude of the site, and day of the year. These data are used to make a balance of shortwave and longwave net radiation. The resulting net radiation has units of MJ m-2 d-1, that are the same units of the reference latent heat flux (LEref). The daily rate of reference evapotranspiration (ETref) is obtained with the equation:
 |
(7) |
where L is the heat of the vaporization of water. An RStudio script (version 2022.02.3) was developed to obtain the daily values of the reference evapotranspiration rate during the months of the trees growth. With the actual evapotranspiration data of the orchard (ETact) obtained with the eddy covariance method and the reference evapotranspiration (ETref), the monthly crop coefficients (Kc) were obtained with the following equation
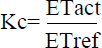 |
(8) |
The equivalent irrigation depth applied to each tree (Dequ_tree) was calculated by dividing the volume of water applied to each tree by the area covered by the tree crown diameter (17.95 m2). Considering that the water evapotranspirated only from the trees canopy is equivalent to the reference evapotranspiration, it is possible to evaluate the efficiency of the water applied by irrigation by comparing the monthly ETref against the monthly Dequ_tree. If they are equal, the water applied to the orchard was enough to fulfill the atmospheric evaporative demand. When Dequ_tree is greater than ETref, an over-irrigation was provided, and for Dequ_tree less than ETref indicates an irrigation deficit. In addition, assuming that the source of evapotranspiration of the orchard is mainly the canopy of the trees, and only 15% of the orchard evapotranspiration corresponds to the soil surface and the native plants (81% of the total surface), the tress canopy evapotranspiration (ETcanopy), could be estimated from the ETact (measured with the eddy covariance system) with the following relation:
 |
(9) |
Where: Ca is the area of the tree canopy, pf is the plantation frame of the orchard, and fprop is the fraction of total evapotranspiration from the canopy trees.
The estimated evapotranspiration rate (ETest) was obtained by multiplying the monthly crop coefficient (Kc) by the daily reference evapotranspiration rate (ETref) of the same month. Statistical comparison between ETact and ETest was performed using the Welch test for paired populations (α ≤ 0.05).
3. RESULTS AND DISCUSSION
The volume of water applied by irrigation to the trees (322.56 L) was the product of 16 emitters per tree multiplied by the rate flow of each emitter (1.68 LPH) for twelve hours of irrigation applied every six days. The average daily volume of water available per tree was 107.52 L, which, divided by the average tree's canopy area (17.945 m2), corresponds to a daily irrigation depth applied to each tree (Deq_tree) of 5.99 mm. Considering that the entire volume of water applied is evapotranspirated by the tree's canopy and that the evaporation of the corridors and space between the trees is negligible (drip irrigation with buried tape), the daily average evapotranspiration rate (with no rain) will be this value.
3.1. Energy Balance
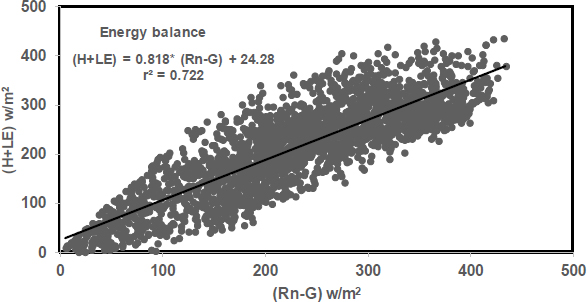
The pecan nut orchard's energy balance (Rn – G = H + LE) was obtained to evaluate the accuracy of the latent heat flux measurements (from which the evapotranspiration rate is obtained). The fluxes were calculated for 30-min averages from 8:00 h to 19:00 h during the months of the trees’ growth (Fig. 1). The sum of sensible and latent heat fluxes (turbulence fluxes) was 18.2% lower than the available energy (Rn-G). This difference may be explained because Rn and G are point determinations while H and LE are the results of the measurements of the fluxes that originated on a large surface. Besides, the other components of the energy balance equation (energy stored in the air, vegetation, and photosynthesis) are not considered. Previous studies have reported similar results. The study [15] in pastures from various climates demonstrated that the sum of the fluxes due to turbulence is usually between 10% and 30% lower than the available energy. Several studies on various types of vegetation and climates from the US flux net (FLUX NET) have demonstrated that turbulent fluxes are nearly 20% lower than the available energy [16]. The energy balance closure problem on diverse plant surfaces indicates that the sum of the flows due to turbulence is around 20% lower than the available energy [17]. In a bell pepper crop, the sum of the flows due to turbulence was 16% lower than the available energy [18].
3.2. Diurnal Energy Flows
The net radiation (Rn) on the pecan nut orchard at daylight hours (8:00 h to 19:00 h), during the months of the trees’ growth, was primarily dissipated in the soil surface heat flux (G), sensible heat flux (H) and, to a lesser extent, in latent heat flux (LE) (Fig. 2). For a plantation frame of 8 m between trees and 12 m between rows of young trees with a canopy area of 17.95 m2, the vegetated surface only covered 18.70% of the entire surface (17.95/96). Therefore, the incident solar radiation was received on bare soil that covered 81.3% of the total surface. Consequently, the most significant dissipation of Rn was on G.
For this study, the highest daily incidence of Rn was dissipated at 47% in G, 24% in H, and 18% in LE. For pecan nut orchards with older trees, where the canopy covers most of the ground surface, latent heat flux is the primary mechanism of net radiation dissipation. The study [19] mentioned that the most significant energy dissipation is in latent and sensible heat flux and, to a lesser extent, in soil heat flux. In nut orchards with mature trees with greater ground cover and bigger interception of solar radiation. In pecan nut orchards with 50-year-old trees of 14 m, net radiation can dissipate up to 80% in latent heat flux [5, 20]. In orchards with mature fruit trees, such as mango trees, net radiation can be dissipated by up to 81% in latent heat flux, 14% in sensible heat flux, and less than 5% in soil heat flux [21-23]. In fruit orchards with less coverage, such as young, 13-year-old Kiwi (Actinidia deliciosa) trees, the net radiation can be dissipated by up to 50% in latent heat flux during the warmer months of June, July, and August [24].
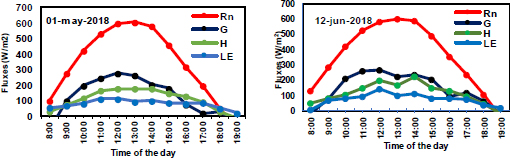
The highest incidence of net radiation occurs between 12:00 h and 14:00 h, which corresponds to the maximum value of soil surface heat flux (G), sensible heat (H), and latent heat (LE) (Fig. 2). The daily rate of evapotranspiration (ET) is obtained by dividing the integrated diurnal latent heat flux (8:00 h to 19:00 h) by the heat of vaporization of water. For the dates shown in Fig. (2) (May 1, June 12, July 15, and August 12), the evapotranspiration rates (mm) were 1.94, 1.85, 2.11, and 1.73, respectively. The daily rate of ET is much higher in older pecan nut orchards with greater canopy development. The evapotranspiration rate of pecan nut trees over 40 years old reached 8 mm/d in June [25]. The work [5] reported average values of 5.23 mm/d and 4.82 mm/d for June and July, respectively, for adult pecan nut trees. The values found in this study that focuses on younger pecan nut trees with small canopies are much lower.
3.3. Daily Measured and Reference Evapotranspiration Rate of the Orchard
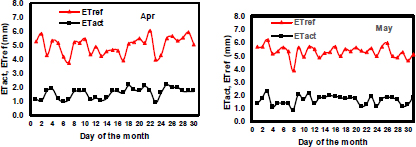
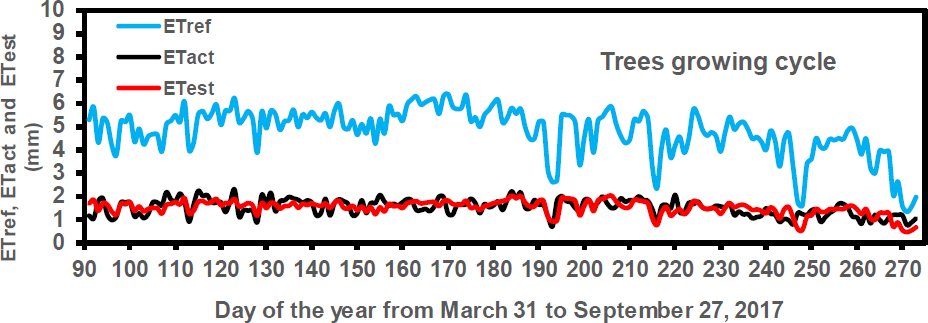
During the months of the trees’ growth, the measured daily evapotranspiration rate (ETact) obtained using the eddy covariance system was much lower than the reference evapotranspiration (ETref) obtained using the FAO Penman-Monteith method (Figs. 3 and 4). This difference appears because the ETref corresponds to the water consumption of grass that completely covers the surface (12 cm of height) with no soil water deficit. The ETact is mainly the evapotranspiration of the canopy of the orchard trees, which only covered 18.69% of the total area. For the months evaluated (Figs. 3 and 4), the daily average rate of ETref was 4.79 mm, and ETact was only 1.5 mm; ETref is 3.193 times higher than ETact. This difference indicates that the crop coefficient (Kc) for a pecan nut orchard with these characteristics must be small (1.5/4.79). For pecan nut orchards with older trees and larger canopy and crown diameters, ETact may be equal to or greater than ETref. Studies conducted by González-Cervantes et al. (2012) in 30-year-old pecan nut orchards demonstrated that ETact and ETref were very similar to each other, with daily averages of 5.6, 6.1, 5.7, and 4.7 mm for May to August, respectively. In that study, the Kc (crop coefficient) value was approximately one. The studies [26, 27] observed that in adult pecan orchards, the daily rate of ETact during the summer reaches 8 mm and is often higher than the rate of ETref.
From Fig. (4), the ETact measured with the eddy covariance system (of the total surface of the orchard) from March to September was around 1.3 mm/day. The evapotranspiration rate only from the trees canopy calculated with Ec (9) was 5.91 mm. This value will be the rate of ET if the tress canopy covers the whole surface of the orchard.
| Month | ETact | ETref | Kc |
|---|---|---|---|
| - | (mm) | (mm) | - |
| April | 47.26 | 148.86 | 0.317 |
| May | 49.47 | 164.29 | 0.301 |
| Jun | 48.17 | 169.41 | 0.284 |
| July | 52.03 | 149.61 | 0.348 |
| August | 43.82 | 139.72 | 0.314 |
| September | 33.71 | 104.44 | 0.323 |
| Month | ETref | Dequ_Tree | Dequ_Tree - ETref | Volume per Tree |
|---|---|---|---|---|
| - | (mm) | (mm) | (mm) | (L) |
| April | 148.86 | 179.7 | 30.84 | 553.58 |
| May | 164.29 | 185.69 | 21.4 | 384.13 |
| Jun | 169.41 | 179.7 | 10.29 | 184.71 |
| July | 149.61 | 185.69 | 36.08 | 647.64 |
| August | 139.72 | 185.69 | 45.97 | 825.16 |
| September | 104.44 | 179.7 | 75.26 | 1350.92 |
3.4. Determination of the Monthly Crop Coefficients
For each month from April to September ETref was higher than ETact (Table 1). The crop coefficient (Kc) was higher in July (0.348) and lower in June (0.248). The average value of Kc was 0.316 and the coefficient of variation was 6.84%. The small values of Kc are due to the small area covered by the trees canopy on the whole surface (18.69%).
For orchard nuts with bigger trees, the values of Kc are greater. For instance, in mature pecan nut orchards in El Paso, Texas, USA, the crop coefficient (Kc) was 0.89 in August [28]. Studies [27, 29] in the same locality reported Kc values greater than 1.0 in July, August, and September. Evapotranspiration studies on 279 pecan orchards with remote sensing in the Rio Grande Valley, New Mexico, demonstrated that the maximum and average annual Kc are 0.70 and 0.55, respectively [30]. These results show a significant variation in Kc values between pecan nut orchards.
3.5. Reference Evapotranspiration and Water Applied to the Trees
For each month (April to September), the equivalent irrigation depth (Dequ_tree) was higher than the reference evapotranspiration FAO Penman-Monteith (ETref) (Table 2). This indicates that for every month the trees were over-irrigated. The difference between Dequ_tree and ETref represents the depth of over-irrigation. As the ETref was different each month (because of different weather conditions), over-irrigation was also different.
The lower over-irrigation was in June (10.29 mm) and the higher in September (75.26 mm). The surplus of water applied (liters) at each tree in the various months is also shown in the last column of Table 2. An excess of 3 946.13 L of water was applied from April to September. One explanation for this over-irrigation is that the growers apply the same volume of water and do not consider the changes in the rate of monthly evapotranspiration in the irrigation scheduling. The work [31], reported that many pecan nut growers schedule the irrigation using the same time intervals applying equal water depths that may result in overwatering and water waste. Studies conducted [27] showed that in the pecan nuts areas of New Mexico and Texas, the water depth applied was 1 940 mm and 1870 mm respectively when the evapotranspiration rate was 1 200 mm and 1 700 mm, indicating an over-irrigation.
3.6. Daily Evapotranspiration Rate Measured and Estimated from Reference Evapotranspiration
The daily evapotranspiration rate estimated from the reference evapotranspiration (ETest = ETref * Kc) was statistically equal (Welch, α ≤ 0.05) to the daily evapotranspiration rate measured with the eddy covariance system (ETact) (Fig. 4). The importance of this result is the possibility of programming the irrigation of the orchard trees from the reference evapotranspiration since the information required to generate the ETref is more accessible and less expensive than the information required to obtain ETact. For example, if the ETref of the previous three days was 14 mm and the crop coefficient is 0.301 the rate of ETest would be 4.214 mm. This value corresponds to 42.14 m3 ha-1. If the orchard has 104 trees/ha, each tree must be irrigated with 405.19 L of water to replace the water consumed. This procedure could be applied for the irrigation scheduling of any pecan orchard from the ETref and the crop coefficients.
The annual evapotranspiration rate of pecan nut orchards ranges from 500 to 1,400 mm and depends on the trees’ size and climatic conditions [32]. In mature pecan nut orchards with 120 trees per ha and a crown diameter of 61.4 m2, ETact was up to 1 167 mm during the growing season (March to October) [28]. For the months of highest evaporative demand, the daily ETact of mature pecan nut orchards (120 trees/ha) can be up to 8 mm/day [27]; this corresponds to a volume of 80,000 L ha-1 of water evapotranspirated for 120 trees per ha gives 666.66 L per day per tree. This volume of water is 48.38% higher than the volume of water applied to the trees of the orchard where this study was carried out due to the size of the trees.
CONCLUSION
This study showed that by comparing the rate of the reference evapotranspiration (ETref) against the irrigation depth applied to the trees in the irrigation scheduling, it is possible to reveal cases of surplus or deficit of water applied to a pecan nut orchard. It was also shown that the volume of water to provide to each tree could be determined by knowing the ETref of the previous days before the irrigation and the crown diameter of the trees.
LIST OF ABBREVIATIONS
| Ts | = sonic temperature |
| Ta | = air temperature |
| ETcanopy | = canopy evapotranspiration |
ETHICS APPROVAL AND CONSENT TO PARTICIPATE
Not applicable.
HUMAN AND ANIMAL RIGHTS
No animals/humans were used for studies that are the basis of the research.
RESEARCH INVOLVING PLANTS
Plants involved in this study are not endangered.
CONSENT FOR PUBLICATION
Not applicable.
AVAILABILITY OF DATA AND MATERIALS
The data and supportive information are available within the article.
FUNDING
Mexican Agency for Science and Technology (CONACYT), Antonio Narro Agrarian University (UAAAN).
CONFLICT OF INTEREST
The authors declare no conflict of interest, financial or otherwise.
ACKNOWLEDGEMENTS
To the UAAAN for funding the establishment and operation of the field study. To the CONACYT for the support to one of the authors and to the IIE Scholar Rescue Fund for funding one of the authors.