All published articles of this journal are available on ScienceDirect.

Life Cycle Assessment (LCA) of Third-Generation Biodiesel Produced Heterotrophically by Phormidium Autumnale
Authors Info & Affiliations
Abstract
Objectives:
The aim of this work was to perform a prospective life cycle assessment of the third-generation biodiesel (3G) produced from the heterotrophic cultivation of Phormidium autumnale, using sucrose as the carbon source.
Materials and Methods:
The study focused on the optimization of the process parameters, in the life cycle assessment and in the biofuel quality analysis in diverse microalgae-based scenarios.
Results:
In the best scenario, the production of microalgal biodiesel has positive energy production (50.59 MJ/kg) associated with low consumption of water (28.38 m3/kg) and low CO2 emissions (9.18 kg CO2-eq/kg). In terms of composition, this oil was predominantly saturated (45.20%), monounsaturated (34.70%), and polyunsaturated (19.90%), resulting in a biodiesel that complies with U.S., European, and Brazilian standards.
Conclusion:
The high potential capacity for lipid production obtained is interesting for the generation of quality biodiesel that meets or surpasses the most stringent U.S., European, and Brazilian fuel standard requirements.
1. INTRODUCTION
According to the International Energy Agency (IEA), more than 80% of the world’s primary energy supply derives from fossil fuels [1]. Expanding energy demand is associated with the growth of developing economies, which represents a considerable increase in the consumption of transport fuels. This is driving a shift towards biofuels. As a result of this, biofuel research and development has progressed through several stages globally and within Brazil [2]. The microalgal oil industry, though presently in its infancy, could provide future liquid transportation fuels that can improve world energy security.
In addition, microalgae-based fuels are third-generation biofuels and may offer a promising biofuel option. Their high growth rates and lipid content, after extraction, are trans-esterified to obtain biodiesel, thus turning them into one of the most promising feedstocks [3, 4]. Some microalgae can grow heterotrophically in stainless steel fermenters on organic substances (e.g., sugars, organic acids) used as the only source of carbon and energy. In the heterotrophic culture of microalgae, glucose is the most commonly used source of organic carbon [5]. However, the high cost of glucose, which sometimes reaches about 80% of the total cost of the medium, makes the heterotrophic cultivation of microalgae economically infeasible [6]. An alternative to lowering the cost of production by up to 40% is to replace certain sources of organic carbon with low-cost substrates, such as sucrose [7]. Therefore, it is important to know the lifecycle performance of microalgae biodiesel production systems in order to establish the environmental benefits over conventional products.
Currently, numerous research has focused on the Life Cycle Assessment (LCA) of microalgal biofuels, but little work has focused on heterotrophy. In addition, published LCA data are based on already existing data in the literature, often presenting extrapolated results that generate doubts about the production process. Every activity involved in the production of biofuels from microalgae is energy-intensive and produces greenhouse gases, besides having a high consumption of water; thus, it is, of course, essential to evaluate the energy balance, CO2 emissions, and water footprint of microalgal fuels [8]. Many life cycle assessments, based on viability studies that use the net energy balance or net energy ratio as viability indicators, have already been attempted for the production of liquid fuels from microalgae, but most studies have shown very low or negative values for the energy balance [9-11].
Life cycle assessment is divided into three sections: energy balance, water footprint, and an analysis of greenhouse gases. Worldwide, Life Cycle Assessment (LCA) is recognized as a standardized and structured method for evaluating the environmental impacts arising throughout the entire life cycle of a product, process, or activity [12]. The biggest challenge in crafting an LCA is that it must address these impact categories during early-stage processes while ultimately accounting for the whole scope of product development. Additionally, LCA is extremely helpful in determining the energy products and co-products, which can demonstrate economic viability and performance [13].
In this sense, the aim of this work was to perform a prospective life cycle assessment of the third-generation biodiesel produced from the heterotrophic cultivation of Phormidium autumnale, using sucrose as the carbon source. The study focused on the optimization of the process parameters, in the life cycle assessment and in the biofuel quality analysis in diverse microalgae-based scenarios.
2. MATERIAL AND METHODS
2.1. Goal and Scope Definition
The technical framework for the LCA methodology, according to the International Organization for Standardization (ISO) 14000 series [14], consists of four phases: (1) goal and scope definition, (2) inventory analysis, (3) impact assessment, and (4) interpretation. Data were obtained from experiments in a laboratory, where the necessary requirements for the process and for the inventory were selected. Subsequently, the data were normalized for a functional unit of 1 kg biodiesel. This methodology was used to estimate the energy balance, CO2 emissions, and the water footprint.
Since microalgae biofuel industry is still a recent process, data on large scale microalgae production is lacking. In the present study, laboratory observations combined with published data of known industrial processes have been used and extrapolated [9, 15, 16]. Furthermore, the calculation experimental is based on promising technologies which might be commercialized in the near future to determine the development potential.
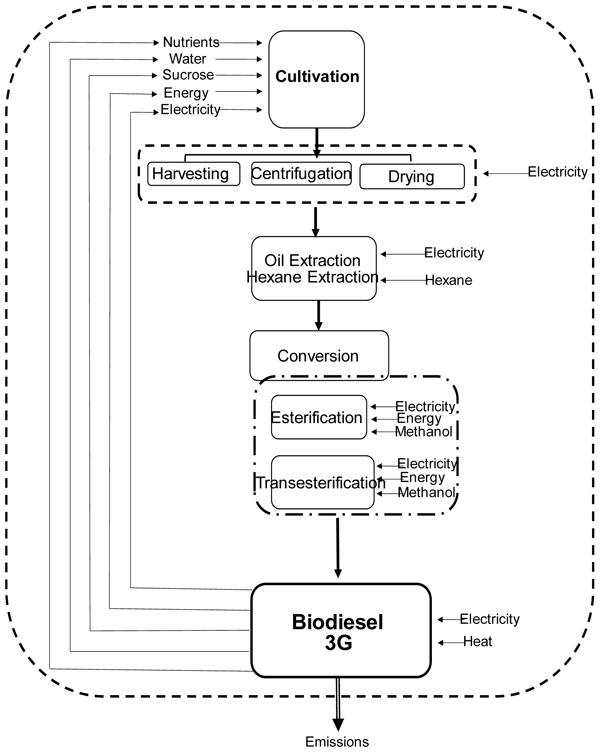
As shown in Fig. (1), the proposed process of microalgal biodiesel production can be divided into nine sections.
2.2. Microalgae Biomass Cultivation and Harvesting
Axenic cultures of Phormidium autumnale were originally isolated from the Cuatro Cienegas desert (26º59'N, 102º03'W-Mexico). Stock cultures were propagated and maintained in solidified agar-agar (20 g/L) containing synthetic BG11 medium [17]. The incubation conditions used were temperature of 25 ºC, a photon flux density of 15 µmol/m2/s and a photoperiod of 12:12 h (light: dark). To obtain the inoculums in a liquid form, 1 mL of sterile synthetic medium was transferred to slants, the colonies were scraped and then homogenized with the aid of mixer tubes. The entire procedure was performed aseptically.
2.3. Process Description
Single-cell oil production was made in a bubble column bioreactor. The reactor specifications were followed according to Francisco et al. [18].
Experiments were performed in a bioreactor operating in batch mode, fed with 2.0 L of culture medium. The experimental conditions were as follows: Initial concentration of inoculum 100 mg/L, temperature 30°C, pH adjusted to 7.6, aeration of 1 VVM (volume of air per volume of culture per minute), and absence of light. The culture medium consisted of BG11 synthetic medium modified and supplemented with different concentrations of sucrose to obtain carbon/nitrogen ratios of 20 (C20), 30 (C30), 35 (C35), 40 (C40), 50 (50), 60 (C60), 70 (C70), and 80 (C80). The concentration of sucrose was adjusted stoichiometrically according to the methodology proposed by Francisco et al. [19].
The experiments were each performed twice and in duplicate. Therefore, kinetic data refer to the mean value of four repetitions.
2.4. Microalgae Oil Extraction
The lipid fraction was extracted from the biomass using the solvent extraction method, obtaining an immiscible system comprising a sample water content and a mixture of chloroform and water [20]. The total lipid concentration was determined gravimetrically from the chloroform extract by evaporating the chloroform in an atmosphere of nitrogen and subsequently drying to constant weight in a vacuum oven.
2.5. Biodiesel Production
The method of Hartman and Lago [21] was used to saponify and esterify the dried lipid extract to obtain fatty acid methyl esters (biodiesel). Fatty acid composition was determined using gas chromatography. Fatty acid methyl esters were identified by comparing retention times with authentic standards, quantified through area normalization by Chromatography Station T2100p (Plus Edition) v9.04 software.
The fuel properties of biodiesel (Ester Content, EC; Cetane Number, CN; Iodine Value, II; Degree of Unsaturation, DU; Saponification Value, SV; Long-Chain Saturated Factor, LCSF; Cold Filter Plugging Point, CFPP; Cloud Point, CP; Allylic Position Equivalents, APE; Bisallylic Position Equivalents, BAPE; Oxidation Stability, OS; Higher Heating Value, HVV; kinematic viscosity, m and kinematic density, ρ; were determined for the best condition optimized of the study, and the properties of biodiesel were calculated by the BiodieselAnalyzer© 1.1 software, which estimates properties based on the fatty acid profile of the parent oil, through a system of empirical equations [22].
2.6. Life Cycle Inventory (LCI)
Table 1 summarizes data sources and information obtained for parameters of the process and energy requirements. These data were analytically evaluated in order to quantify and compile all the input and output flows for each stage within the process chain.
| Stages | In/out | Utilities/Materials | Base Case | Amount (by scenarios) | |||||||
|---|---|---|---|---|---|---|---|---|---|---|---|
| - | - | - | - | C20 | C30 | C35 | C40 | C50 | C60 | C70 | C80 |
| Cultivation | Input | Water (m3) | 1 | - | - | - | - | - | - | - | - |
| - | - | Electricity (kWh) | 0.1 | - | - | - | - | - | - | - | - |
| - | - | Industrial sterilizer (kWh) | 0.05 | - | - | - | - | - | - | - | - |
| - | Output | Microalgal broth (kg) | - | 2.7 | 5.26 | 5.6 | 6.17 | 5.33 | 2.9 | 1.9 | 1.68 |
| Harvest | Input | Electricity (kWh) | 0.13 | - | - | - | - | - | - | - | - |
| - | - | Centrifugal pump (kWh) | 0.75 | - | - | - | - | - | - | - | - |
| - | - | Microalgae broth (L) | 0.86 | - | - | - | - | - | - | - | - |
| - | - | Drum dryer (kWh) | 4 | - | - | - | - | - | - | - | - |
| - | Output | Dry microalgae (kg) | - | 2.7 | 5.26 | 5.6 | 6.17 | 5.33 | 2.9 | 1.9 | 1.68 |
| Oil Extraction | Input | Storage tank hexane (kWh) | 0.38 | - | - | - | - | - | - | - | - |
| - | - | Storage tank oil (kWh) | 0.38 | - | - | - | - | - | - | - | - |
| - | - | Centrifugal pump (kWh) | 0.75 | - | - | - | - | - | - | - | - |
| - | - | Evaporator/Stripper (kWh) | 0.12 | - | - | - | - | - | - | - | - |
| - | - | Centrifuge (kWh) | 0.75 | - | - | - | - | - | - | - | - |
| - | - | Desolventizer-Toaster-Dryer- Cooler (DTDC) (kWh) |
0.35 | - | - | - | - | - | - | - | - |
| - | - | Electricity (kWh) | 0.13 | - | - | - | - | - | - | - | - |
| - | - | Heat (MJ) | 41 | - | - | - | - | - | - | - | - |
| - | Output | Microlgal oil (kg) | - | 0.54 | 1.05 | 1.12 | 1.23 | 1.06 | 0.58 | 0.38 | 0.33 |
| Biodiesel Production | Input | Microalgal oil (kg) | - | 0.54 | 1.05 | 1.12 | 1.23 | 1.06 | 0.58 | 0.38 | 0.33 |
| - | - | Storage tank Methanol (kWh) | 0.38 | - | - | - | - | - | - | - | - |
| - | - | Storage tank hydrochloric acid (kWh) | 0.38 | - | - | - | - | - | - | - | - |
| - | - | Storage tank chloroform (kWh) | 0.38 | - | - | - | - | - | - | - | - |
| - | - | Centrifugal pump (kWh) | 0.75 | - | - | - | - | - | - | - | - |
| - | - | Evaporator/Stripper (kWh) | 0.90 | - | - | - | - | - | - | - | - |
| - | - | Desolventizer-Toaster-Dryer-Cooler (DTDC) (kWh) | 0.35 | - | - | - | - | - | - | - | - |
| - | - | Electricity (kWh) | 0.13 | - | - | - | - | - | - | - | - |
| - | - | Heat (MJ) | 41 | - | - | - | - | - | - | - | - |
| - | Output | Biodiesel (MJ) | - | 22.14 | 45.11 | 44.31 | 50.59 | 43.70 | 23.78 | 15.58 | 13.77 |
2.6.1. Energy Balance
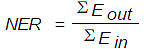
The Net Energy Ratio (NER) of a system is defined as the ratio of the total energy produced (energy content of the residual biomass) over the energy required for all plant operations [10]. Energy is reported in terms of Megajoules (MJ) and is calculated according to Eq. (1):
 |
(1) |
where Eout is the renewable energy output, and Ein is the fossil fuel energy input.
Energy Balance (EB) considered all forms of energy of the system, calculated according to Eq. (2):
 |
(2) |
Output energy was quantified by multiplying the energy potential of microalgal biodiesel, expressed in MJ/kg [7].
2.6.2. Water Footprint
The Water Footprint (WF) was determined as the sum of the water used in the system during all stages of the process of microalgal biodiesel production, expressed in m3/kg biodiesel.


2.6.3. Evaporation Rate
The evaporation rate of the process was calculated according to Eq. (5), where the loss of mass (m) is obtained per unit time at a given temperature (°C):
 |
(5) |
In this study, the water footprint associated with the culture process is caused by evaporation, therefore, it will not be considered the gray water footprint, since microalgae have the removal capacity of pollution load of the effluent that will be thrown in the watershed, thus, it will be considered only the green and blue water footprint.

3. RESULTS AND DISCUSSION
3.1. Energy Balance
Assessing the sustainability of a biofuel production system requires energy input analysis over the life cycle. In this sense, biomass production, oil production, and the energy balance of 3G biodiesel production from heterotrophic cultivation by Phormidium autumnale were examined. The results are summarized in Table 2.
| - | Balance Energy | |||||
|---|---|---|---|---|---|---|
| Scenario | Biomass (kg/m3) |
Oil (kg/m3) |
Fossil Energy Input* (MJ) |
Produced Energy Output (MJ) | Energy Ratio | Energy Balance (MJ) |
| C20 | 2.7a ± 0.03 | 0.54a ± 0.01 | 27.21a | 22.14a ± 0.01 | 0.81a ± 0.01 | 5.07a ± 0.01 |
| C30 | 5.26b ± 0.03 | 1.05b ± 0.01 | 27.21a | 45.11b ± 0.01 | 1.65b ± 0.01 | -17.90b ± 0.01 |
| C35 | 5.6c ± 0.03 | 1.12c ± 0.01 | 27.21a | 44.31c ± 0.02 | 1.62c ± 0.01 | -17.10c ± 0.01 |
| C40 | 6.17d ± 0.03 | 1.23d ± 0.01 | 27.21a | 50.59d ± 0.01 | 1.85d ± 0.01 | -32.38d ± 0.01 |
| C50 | 5.33b ± 0.03 | 1.06b ± 0.02 | 27.21a | 43.70e ± 0.01 | 1.60c ± 0.01 | -16.49e ± 0.01 |
| C60 | 2.9e ± 0.03 | 0.58f ± 0.01 | 27.21a | 23.78f ± 0.01 | 0.87e ± 0.01 | 3.43f ± 0.01 |
| C70 | 1.9f ± 0.03 | 0.38g ± 0.02 | 27.21a | 15.58g ± 0.02 | 0.57f ± 0.01 | 11.63g ± 0.01 |
| C80 | 1.68g ± 0.03 | 0.33h ± 0.01 | 27.21a | 13.77h ± 0.02 | 0.50g ± 0.01 | 13.44h ± 0.01 |
The best performance of the process was achieved in between scenarios C30 and C50, with maximum biomass production and oil in scenario C40. In this condition, average biomass production was 6.17 kg/m3, resulting in oil production of 1.23 kg/m3. These results show that in heterotrophic metabolism, the production of intracellular oils by Phormidium autumnale is critically affected by the carbon/nitrogen ratio in the culture medium.
As shown in Table 2, the energy balance is a function of the oil production. The condition that presented the best performance was the scenario C40, with higher values fossil energy input (27.21 MJ), energy output (50.50 MJ), energy ratio (1.85 MJ) and energy balance (-32.38 MJ), followed by the scenarios C30, C35 and C50. These results show that primary energy contained in the biomass is greater than the primary energy input in all the system (NER > 1), demonstrating that these processes have a great potential for energetic exploitation.
In the other scenarios (C20, C60, C70, and C80) the energy balance was unfavorable. There is a linear relationship between biomass and oil production and energy ratio. This is associated with the metabolism of microalgae; these microorganisms possess structurally specific mechanisms for the active transport of sucrose into the cell membrane. Heterotrophic microalgae have an inducible active carbohydrate symport system responsible for the uptake of these molecules from the culture medium. Induction of this transport is achieved by specific sugars. If the concentration and type of sugar are adequate in the culture, the symport system is induced to promote greater cell growth and, consequently, higher yields of biomass and oil production [23].
By comparison, soybean is one of the most-used oil crops for the production of biodiesel. According to Fore et al. [24], the production of biodiesel from soybean requires energy input of 4588 MJ, generating fossil energy output of 21.401 MJ. The soybean crop needs a larger area for cultivation, overcoming traditional crops such as sugarcane. The higher energy expenditure at the entrance of the system is related to the higher consumption of fertilizers [25]. According to Pradhan et al. [25], these values reach an energy expenditure of approximately 319 MJ/kg for the use of herbicides and 325 MJ/kg for the use of insecticides.
Compared to other biofuels of organic origin, such as soybean biodiesel and bioethanol from sugar cane, microalgae do not compete for arable land [26]. Thus, with biodiesel 3G was possible to get on the best scenarios required an energy input of 27.21 MJ to generate fossil energy output of 50.50 MJ. The value of the energy produced by microalgae is twice as large as that of the biodiesel produced by soybean.
On the other hand, the biodiesel 3G may be produced by microalgae that use sucrose as the substrate, making it a more profitable alternative than bioethanol from sugar cane. In sugarcane biorefinery, the bioethanol production requires a fossil energy input of 1 MJ per kilogram of sugar cane, which generates 0.05 MJ of output energy per kilogram of bioethanol produced. These values reached an unfavorable energy of 0.05 MJ [27]. Moreover, it was considered that the total energy yield (bioethanol and bagasse) is 2.185 MJ per kg of cane, if consider only 11% of the total energy of bioethanol production using the microalgae, it is possible to achieve 3.52 MJ per kg of the sugar-cane. This value is larger compared to the total of energy (bioethanol) produced by sugarcane [28]. The microalgae biodiesel demonstrated a high potential of energetic exploration since the final yield of the process exceeded the demand for energy in the system input, promoting the sustainability of this technological route.
3.2. CO2 Emissions
The environmental impact of converting sucrose to oil is analyzed based on emissions over the complete life cycle. It is important to consider the CO2 emission per unit of energy output from products, since the principal objective of any biodiesel system is to produce an energy carrier. Table 3 shows the CO2 emissions under the eight scenarios calculated per unit of mass and energy output (MJ/kg).
| Scenario | Emissions of CO2 (kg CO2-eq/kg biodiesel) |
|---|---|
| C20 | 6.58a ± 0.01 |
| C30 | 8.23b ± 0.01 |
| C35 | 27.12c ± 0.01 |
| C40 | 18.09d ± 0.01 |
| C50 | 7.71e ± 0.01 |
| C60 | 10.51f ± 0.01 |
| C70 | 10.62g ± 0.01 |
| C80 | 16.47h ± 0.01 |
As shown in Table 3, CO2 emissions per kg of biodiesel were the lowest in scenario C20, followed by C50. The highest emissions of CO2 were found in scenario C35, followed by C60 and C80. While scenario C20 produced the fewest emissions of CO2, it also produced less energy. These results suggest that adding less sucrose to the culture requires less energy for the microalgae to convert the carbon. Thus, respiration releases less CO2, since carbohydrates in heterotrophic cultivation serve as the sole source of energy [5]. Furthermore, Posada et al. [29] reported that the energy demanded to supply the input of a lower emission of CO2 is higher than that required to emit a higher amount of CO2. Under these conditions, then, the C40 scenario presents the best result in combining energy balance and CO2 emissions. These results agree with Khoo et al. [30], who observed that higher emissions of CO2 will produce more energy by leading to a greater final yield of microalgal biomass.
Comparatively, emissions of CO2 from soybean biodiesel can reach 51 kg CO2-eq/kg, considering both CO2 emissions during the extraction of soybean oil and in the transesterification to obtain biodiesel [31]. Additionally, if CO2 emissions from combustion are included, such emissions are about 70 kg CO2-eq/kg and may represent about 70% of total lifecycle greenhouse gas emissions [32]. The highest CO2 emissions from microalgal biodiesel, observed in scenario C35 (27.12 kg CO2-eq/kg), were still much lower than for soybean biodiesel.
On the other hand, bioethanol utilization in Brazil must consider the whole agro-industrial system. Essentially, a portion of the consumed fossil fuel is used to yield bioethanol for external use as a biofuel in addition to a proportion of the bagasse used for sugar production [26]. According to Khatiwada et al. [2], the CO2 emissions were estimated at 19.1 kg CO2-eq/kg of bioethanol. These data were also supported by Souza and Sansone [33], who conducted an LCA of an integrated Brazilian sugarcane biorefinery with a similar framework, estimating CO2 emissions between 20 kg CO2-eq/kg and 37 kg CO2-eq/kg. These values of CO2 emissions are still higher than the favorable microalgal scenarios under study.
3.3. Water Footprint
In additional, the water footprint includes the inventories of the process water consumed, the water consumption associated with process energetic, of material inputs for each stage of the fuel cycle, and the water credits associated with the coproducts. In this sense, were calculated the green and blue water footprint, and the evaporation rate of the whole production process of biodiesel from microalgae and the results are summarized in Table 4.
| Scenarios | TE | Green WF | Blue WF | Total WF |
|---|---|---|---|---|
| - | m3 per kg of Biodiesel | m3 per kg of Biodiesel | m3 per kg of Biodiesel | m3 per kg of Biodiesel |
| C20 | 0.1442a ± 0.01 | 14.19 a ± 0.01 | 3.95×10⁻⁵ a ± 0.01 | 14.19a ± 0.01 |
| C30 | 0.2163b ± 0.01 | 21.28b ± 0.01 | 7.68×10⁻⁵ b ± 0.01 | 21.28b ± 0.01 |
| C35 | 0.2523c ± 0.01 | 24.82c ± 0.02 | 8.19×10⁻⁵ b ± 0.01 | 24.82c ± 0.01 |
| C40 | 0.2885d ± 0.01 | 28.38d ± 0.01 | 9×10⁻⁵ c ± 0.01 | 28.38d ± 0.01 |
| C50 | 0.3607e ± 0.01 | 35.48e ± 0.01 | 7.75×10⁻⁵ b ± 0.01 | 35.48 e ± 0.01 |
| C60 | 0.4328f ± 0.01 | 42.57f ± 0.01 | 4.24×10⁻⁵ a ± 0.01 | 42.57 f ± 0.01 |
| C70 | 0.5050g ± 0.01 | 49.68 g ± 0.01 | 2.7×10⁻⁵ d ± 0.01 | 49.68 g ± 0.01 |
| C80 | 0.5721h ± 0.01 | 56.28 h ± 0.01 | 2.41×10⁻⁵ d ± 0.01 | 56.28h ± 0.01 |
The blue WF represents the local water requirements for the microalgae-to-biofuel process. Blue WF varies between the scenarios; the lowest consumption of blue water occurred in the C80, C70, and C20 scenarios, with 2.41x10⁻⁵ m3/kg, 2.7x10⁻⁵ m3/kg, and 3.95x10⁻⁵ m3/kg consumption, respectively. Concerning the balance of green water, the scenarios that demonstrated the least water consumption were C20 (14.19 m3/kg), C30 (21.28 m3/kg), and C35 (24.82 m3/kg), followed by C40 (28.38 m3/kg). According to Handler [34], as heterotrophic bioreactors are closed systems, they only require the volume of water necessary for biomass metabolism. This volume is on average 7.5x10⁻⁵ m3/kg, making the blue water consumption low in all scenarios.
By contrast, the total WF is the sum of the blue and green WFs, representing the balance between them. In all the scenarios, total water footprint and evaporation rate increased with increasing sucrose concentration, as expected. The scenario that presented the lowest total water consumption was C20 (3.95x10⁻⁵ m3/kg), followed by C30, C35, and C40. However, the C40 scenario offered the best combination of energy balance and CO2 emissions. Considered as a long-term process, the C40 scenario becomes highly sustainable, with low water consumption, positive energy balance, and low CO2 emissions.
We compared the WF of microalgal biodiesel to the WF of bioethanol. According to Pereira et al. [35], for bioethanol, the total WF of bioethanol produced from sugarcane is 7700 m3/kg, or 4600 m3/kg of green water, 2500 m3/kg blue water, considering irrigation needs, and 500 m3/kg of gray water.
Additionally, Papong et al. [36] evaluated the water balance of bioethanol from sugar cane molasses. The water footprint for this process had a total consumption of 702.79 m3/kg of molasses, being 516 m3/kg for the green water footprint and 186.37 m3/kg for the blue water footprint. In this study the gray water footprint was not considered. Microalgal biodiesel has a small water footprint compared to bioethanol, because microalgae have no gray WF due to their heterotrophic metabolism and because these microorganisms can simultaneously convert organic pollutants present in wastewater.
On the other hand, the water footprint of biodiesel produced from soybean is also much larger than microalgal biodiesel, because it requires relatively large amounts of irrigation combined with smaller biodiesel yields per unit of crop [37]. The WF for biodiesel from soybean is about 42×105 m3 per kg of biodiesel produced, much higher than the best microalgal scenario, C40 (28.38 m3/kg). Thus, microalgal biodiesel is a competitive, alternative source of biodiesel, using less water to produce 3G biodiesel compared to conventional feedstock.
3.4. Oil Composition and Biodiesel Properties
Finally, besides the environmental issues established by the life cycle analysis, the quality of the produced biodiesel will determine its applicability. Thus, we evaluated the properties of biodiesel produced from microalgae. To ensure a final product of high quality, biodiesel must meet the EN 14214, ASTM 6751, or ANP 255 specifications in Europe, the United States, and Brazil, respectively [38-40]. The fatty acid profile, properties of quality, and properties of combustion of the best-performing C40 biodiesel are presented in Tables 5 and 6.
| Fatty Acid Profile | Methyl esters (%) |
|---|---|
| Lauric (12:0) | 4.9 ± 0.1 |
| Myristic (C14:0) | 7.3 ± 0.1 |
| Palmitic (C16:0) | 22.5 ± 0.5 |
| Palmitoleic (C16:1) | 8.5 ± 0.1 |
| Stearic (C18:0) | 10.5 ± 0.2 |
| Oleic (C18:1n9c) | 26.2 ± 0.8 |
| Linoleic (C18:2n6c) | 17.8 ± 0.5 |
| γ-Linolenic (C18:3n6) | 2.10 ± 0.03 |
| ∑Saturated | 45.2 |
| ∑Monounsaturated | 34.7 |
| ∑Polyunsaturated | 19.9 |
| Properties | Microalgae | Soybeana | ANP 255 | ASTM 6751 | EN 14214 |
|---|---|---|---|---|---|
| EC (%) | 99.8 | 96.9 | - | - | min 96.5 |
| CN | 56.31 | 49.0 | min 45 | min 47 | min 51 |
| IV (gl2 100g-1) | 70.04 | 128 | - | - | max 120 |
| DU (%) | 74.5 | 143.8 | - | - | - |
| SV | 211.8 | - | - | - | - |
| LCSF (%) | 7.5 | 1.6 | - | - | - |
| CFPP (°C) | 7.09 | -5.0 | max 19 | - | - |
| CP (°C) | 6.87 | - | - | - | - |
| APE | 66.0 | - | - | - | - |
| BAPE | 22.0 | - | - | - | - |
| OS (h) | 8.52 | 1.3 | - | min 3 | min 6 |
| HVV | 39.5 | - | - | - | - |
| µ (mm2 s-1) | 4.68 | 4.2 | - | 1.9-6.0 | 3.5-5.0 |
| ρ (g cm-3) | 0.87 | - | - | - | - |
Regarding composition (Table 5), this microalgal oil contains eight different compounds, primarily oleic acid (26.2%). The oil was predominantly saturated (45.20%), followed by monounsaturated (34.70%) and polyunsaturated (19.90%). This profile demonstrates the potential application of this type of biomass as an input for biodiesel production, since oils with predominantly saturated and monounsaturated composition are the most suitable for synthesizing biodiesel [41].
The biodiesel produced from microalgal oil has the following fuel properties (Table 6): ester content 99.8%, cetane number 46.31, iodine value 70.04 gl2 100g-1, degree of unsaturation 74.5%, saponification value 211.8, long-chain saturated factor 7.5%, cold filter plugging point 7.09°C, cloud point 6.87°C, allylic position equivalents 66.0, bis-allylic position equivalents 22.0, oxidation stability 8.52 hr, higher heating value 39.5, kinematic viscosity 1.28 mm2 s-1, and kinematic density 0.87 g cm-3. All these parameters comply with the limits established by U.S., European, and Brazilian regulators [38-40] and are comparable to soybean biodiesel [41]. These results indicate the potential to use microalgal biomass as a suitable lipid input for manufacturing biodiesel.
CONCLUSION
Under the various tested scenarios, the best scenario for producing microalgal biodiesel was a ratio of C/N 40, which values for biomass and oil production respectively of 6.17 kg/m3 and 1.12 kg/m3. A life cycle assessment of the third-generation biodiesel produced from the heterotrophic cultivation of Phormidium autumnale in the C40 scenario showed positive energy production (50.59 MJ/kg) associated with a low water footprint (28.38 m3/kg) and low CO2 emissions (18.09 CO2-eq/kg). The high potential lipid production obtained is interesting for generating quality biodiesel that meets or surpasses the most stringent U.S., European, and Brazilian requirements.
ETHICS APPROVAL AND CONSENT TO PARTICIPATE
Not applicable.
HUMAN AND ANIMAL RIGHTS
No animals/humans were used for studies that are the basis of this research.
CONSENT FOR PUBLICATION
Not applicable.
CONFLICT OF INTEREST
The authors declare no conflict of interest, financial or otherwise.
ACKNOWLEDGEMENTS
The authors are grateful to the National Academic Cooperation Program PROCAD/CAPES and National Counsel of Technological and Scientific Development (CNPq) for the financial support.