All published articles of this journal are available on ScienceDirect.

Biomethanization of the Mixture of Cattle Manure, Pig Manure and Poultry Manure in Co-Digestion with Waste Peels of Pineapple Fruit and Content of Chicken-Gizzard - Part II: Optimization of Process Variables
Abstract
Background:
The indiscriminate discharge of industrial waste, agricultural-biomass waste, waste of municipal, domestic and kitchen waste has negatively impacted on the environment and human health. It is very pertinent to reduce these impacts to the barest minimum through conversion of the waste to useful products. The conversion of these wastes to generate alternative energy to fossil fuel through the technology of anaerobic fermentation is one of the viable and more fascinating options for the management of waste.
Objective:
To investigate the interactive effect and optimization of process parameters of temperature, total solid content and feed/inoculum ratio on the biomethanization of the mixture of cattle manure, pig manure and poultry manure in co-digestion with waste peels of pineapple fruit and content of chicken-gizzard.
Method:
Full-factorial central composite design of experiment (RCCD) of the response surface method (RSM) was adopted to assess the possible interactive effects of the process variables and the optimal parameters (i.e. optimization) for biogas/biomethane production in an anaerobic digester.
Result:
The process variables had a significant (P < 0.05) positive and negative interactive effect on the biomethanization process. A second-order quadratic polynomial regression model which is statistically significant (p < 0.0001) was respectively obtained for cumulative biogas yield (CBY), biomethane content (BC) and hydraulic retention time (HRT). Temperature of 55.2°C; total solid content of 6.25%; and feed/inoculums ratio of 1:2 were found to be the optimum values required to attain a predicted optimum values of 6.261 dm3/g CBY, 71.54% BC within a minimum 8 days of HRT. At this optimum process conditions, the experimental observed maximum CBY, and BC with a minimum HRT were found to be 6.217 dm3/g of slurry, 71.10% and 7 days, respectively.
Conclusion:
Biogas/biomethane generation through co-substrate anaerobic fermentation of animal waste with waste of fruits constitute a reasonable and applicable renewable energy alternative and this can be optimized through response surface methodology.
1. INTRODUCTION
Degradation of the environment, human health problem and global change in climate due to greenhouse emissions have been observed to be some of the deleterious and negative impacts of petroleum fuel as the world major source of energy. As a result of these negative impacts, researchers have been stimulated to explore and exploit new sources of energy which are renewable as well as eco-friendly. Renewable sources of energy are biomass which may include plant and agricultural food materials and their wastes, animal waste, municipal waste, etcetera [1, 2]. The biomass can be converted into biogas being one of the renewable and sustainable forms of energy [3]. This conversion can be achieved through the technology of anaerobic fermentation or digestion. This is a technology that involves the action of microorganisms in the degradation of organic or biological materials in the absence of atmospheric oxygen [4, 5]. The process of producing biogas or biomethane through anaerobic fermentation is referred to as biomethanization or biomethanation. The conversion of the biomass or waste through anaerobic fermentation technology follows four major pathways which are hydrolysis, acidogenesis, acetogenesis and methanogenesis [6].
Biogas is produced or generated in a biodigester and as a form of renewable energy which is majorly constituted with methane has found use in heating, cooking, lighting and generation of power [7]. The production of biogas or biomethane is enhanced with the combination of two or more substrates in a biodigester than when a single substrate is utilized [8-11]. The enhancement due to co-digestion may be as a result of the improved C/N ratio, macro and micro nutrient and pH [11, 12]. Animal manure (AM) has been found to be very good and fascinating animal waste to be used as substrate or feed ingredient for biogas or biomethane production due to its high organic matter, high capacity for buffering, high nutrient variability and high microbial load [13]. Furthermore, wastes of fruit or agricultural food materials (AFM) have been observed to have the potential to be used in combination as co-substrates with AM due to its high carbohydrate content and high digestibility [11, 14].
Biomethanization as a phenomenon is dependent on certain physical and biological variables such as pre-treatment of feedstock, total solid content (TSC), temperature, pH, agitation, hydraulic retention time and concentration of substrate/nutrients, C/N ratio and feed/inoculum ratio [15, 16]. All these variables or factors need to be properly monitored and controlled so as to obtain optimum yield of biogas or biomethane [17]. It is to be noted that most of the previous studies on biogas generation made use of classical or conventional method of optimization which entails variation of one factor at a time, while keeping other factors constant. That is, the effects of these factors were individually investigated without proper consideration for the possibility of their interactive effects as it was done in part I of our study. Such optimization procedure needs several experimental runs, and hence it has been found to require considerable time, arduous, hard to reach optimum conditions and low optimization efficiency [9]. To circumvent this limitation, response surface methodology (RSM) which is a statistical tool for experimental designs has been put forward for the determination of individual factors effect and their interactions as well as to optimize the factors. In recent times, optimizations of biological processes have been greatly studied using the RSM [9, 18-26]. However, information on the statistical optimization of biomethanization process in the literature is still limited.
In one of the earlier studies carried out by Ogunleye et al.[11], they reported the effects of biological additives, total solid content of 8 - 40% and pH of 6 - 8.5 on the biomethanation of animal waste (mixture of cattle, pig and poultry dungs) using the single wastes of mango, orange and pineapple fruits and their combined form as co-substrates with chicken rumen used as inoculum [11]. Their study revealed that waste of pineapple fruits used singly as co-substrate with the animal wastes produced higher biogas/biomethane yield than the use of mango or orange and their combined mixture. Therefore, in continuation with this earlier study of Ogunleye et al.[11], the present study tends to investigate using RSM, the interactive effects of temperature from the range of 30 to 60oC, total solid content from 2 to 10% and feed/inoculum ratio from 1:1 to 3:1 on the biomethanization of animal wastes mixture made up of cattle manure, pig manure and poultry manure in co-digestion with the waste of pineapple fruit as co-substrate and content of chicken-gizzard as inoculums [11].
2. MATERIALS AND METHODS
2.1. Feedstock Collection/Preparation
The animal wastes (cattle, pig and poultry manures) utilized in this study as primary substrate were collected from LAUTECH agricultural farm, Ogbomoso, Oyo State, Nigeria. The pineapple fruit wastes and the content of chicken-gizzard respectively used as co-substrate and inoculum were collected from Bodija and Mokola market, Ibadan, Oyo state, Nigeria. All the samples collected were stored in a refrigerator maintained at 4oC prior to further use. The preparation of the substrates and co-substrates as feed ingredients for the biogas/biomethane production was carried out in accordance with the procedure of Iyagba et al. [27]. Primary substrates and co-substrates were washed after which they were dried in the sun for 20 days and then dried in the oven-dryer at 105oC for 24 h. To ensure homogeneity, the dried samples were mechanically grinded with the aid of a mortar and pestle. The animal wastes, content of chicken-gizzard and pineapple fruit wastes were characterized for physical, chemical and biological properties according to standard methods and the results have been presented in our part I study [28-31].
2.2. Experimental Procedure and Biogas Measurement
A constructed 20 kg anaerobic digester used for this study is shown in Fig. (1).
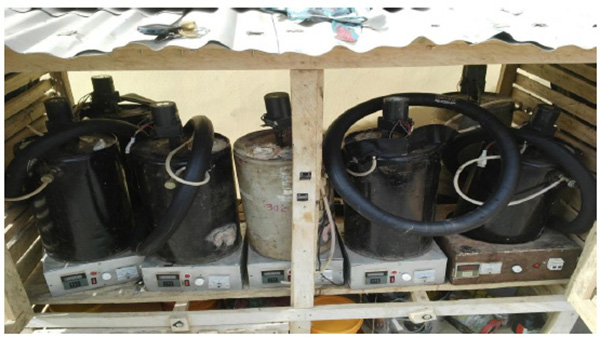
Description of biodigester as shown in Fig. (1) has been presented in part 1 of this study. Twenty experimental runs were conducted using 20 biodigesters. The working capacity of the biodigesters was kept at 12 kg. The experiment was carried out at constant pH (7.5) and agitation (30 rpm). Measurement of the digested slurry pH was carried out with use of a digital pH meter. The produced or generated biogas/biomethane in the anaerobic biodigester was collected directly into a gas bag and the quantity was weighed by means of a weighing scale.
2.3. Qualitative Gas Analysis
Gas chromatography equipment of model Hp 6890 with thermal conductivity detector and Rev. A09.01 (1206) software and having a column of dimensions 30m x1/8mm x 0.85µm was used to analyze the biogas produced. Helium gas with an inlet temperature of 145oC at flow rate of 20 ml/min was used as the carrier gas and the carrier gas inflow in the column was 26 ml/min. The programmed temperature of the oven was at 140oC for 6 min and ramped at 50oC/min which was maintained at 175oC.
2.4. Statistical Design of Experiment
A full-factorial design of experiment was utilized for defining the matrix of experiments. Three experimental variables, temperature (A), total solid content (B) and feed/inoculum ratio (C) interactive impact on three variable responses, CBY, BC and HRT, using the rotatable central composite design (RCCD) under response surface method was investigated. The RCCD design is made up of a complete 2w factorial design, number of center points and two points axially positioned at a distance of α on the axis of each design variables from the design center; where ‘w’ is the number of variables to be tested and α is equal to 2w/4 (= 1.682 for w = 3) [32, 33]. Therefore, the total number of design points is N = 2w + 2w + no, and these data are fitted in a second order polynomial model [32]. Table 1 shows the range and level of variables utilized for the biomethanization experiment. As shown in Table 1, -1, 0, and +1 respectively denotes low, medium (or centre) and high range and levels (i.e. value) of the tested variables while –α and + α are the respective axial points (or value) above the low and high range and levels of the variables. The range and level of variables used in this study were obtained from a preliminary experiment that was carried out in part 1 of this study where the temperature was varied from 25 to 60 oC, feed/inoculums ratio from 1:1 to 3:1 and total solid content from 2 to 10%, respectively.
| Factor Coding | - α | -1 | 0 | +1 | +α |
|---|---|---|---|---|---|
| A (Temperature, oC) | 33.18 | 40 | 50 | 60 | 66.82 |
| B (Total solid content, %) | 2.64 | 4 | 6 | 8 | 9.36 |
| C (Feed/inoculums ratio) | 1:1.66 | 1:2 | 1:2.5 | 1:3 | 1:3.34 |
A full-factorial central composite design with 6 replicates (no = 6) at the central point, all in duplicates which resulted in a total of 20 runs of experiments as presented in Table 2 were used to optimize the tested variables that have impact on the biomethanization process.
| Coded Level | Actual Values | Responses | |||||||
|---|---|---|---|---|---|---|---|---|---|
| Run | A | B | C | Temperature (°C) | Total solid content (%) | Feed/inoculums ratio |
CBY(kg) |
BC(%) | HRT(Days) |
| 1 | -1 | -1 | -1 | 40 | 4.00 | 1:2 | 6.1 | 60.71 | 11 |
| 2 | 1 | -1 | -1 | 60 | 4.00 | 1:2 | 7 | 70.11 | 9 |
| 3 | -1 | 1 | -1 | 40 | 8.00 | 1:2 | 6.2 | 61.90 | 10 |
| 4 | 1 | 1 | -1 | 60 | 8.00 | 1;2 | 7.2 | 71.01 | 9 |
| 5 | -1 | -1 | 1 | 40 | 4.00 | 1:3 | 6.2 | 62.08 | 12 |
| 6 | 1 | -1 | 1 | 60 | 4.00 | 1:3 | 7 | 70.91 | 9 |
| 7 | -1 | 1 | 1 | 40 | 8 | 1:3 | 6 | 60.01 | 13 |
| 8 | 1 | 1 | 1 | 60 | 8.00 | 1:3 | 6.4 | 64.02 | 11 |
| 9 | -1.682 | 0 | 0 | 33.18 | 6.00 | 1:2.5 | 5.6 | 55.99 | 14 |
| 10 | 1.682 | 0 | 0 | 66.82 | 6.00 | 1:2.5 | 6.8 | 68.01 | 11 |
| 11 | 0 | -1.682 | 0 | 50 | 2.64 | 1.2.5 | 6.6 | 66.99 | 9 |
| 12 | 0 | 1.682 | 0 | 50 | 9.36 | 1:2.5 | 6.5 | 64.99 | 11 |
| 13 | 0 | 0 | -1.682 | 50 | 6.00 | 1:1.66 | 6.9 | 69.89 | 7 |
| 14 | 0 | 0 | 1.682 | 50 | 6.00 | 1:3.34 | 6.7 | 66.71 | 10 |
| 15 | 0 | 0 | 0 | 50 | 6.00 | 1:2.5 | 7 | 69.90 | 9 |
| 16 | 0 | 0 | 0 | 50 | 6.00 | 1:2.5 | 7 | 69.90 | 9 |
| 17 | 0 | 0 | 0 | 50 | 6.00 | 1:2.5 | 7 | 69.90 | 9 |
| 18 | 0 | 0 | 0 | 50 | 6.00 | 1:2.5 | 7 | 69.90 | 9 |
| 19 | 0 | 0 | 0 | 50 | 6.00 | 1:2.5 | 7 | 69.90 | 9 |
| 20 | 0 | 0 | 0 | 50 | 6.00 | 1:2.5 | 7 | 69.90 | 9 |
The determination of the experimental design matrix with its analysis of statistics was carried out using the Design-Expert software package. The second-order quadratic polynomial regression model represented by Eq. (1) was fitted to the data of CBY, BC, and HRT, respectively [34, 35].
 |
(1) |
Where Z, predicted response, A, B and C, independent variables, βo is the intercept term, α1 ,α2, α3, are the linear coefficients, α11 ,α22, α33, the quadratic coefficients, and α12 ,α13, α23, the interaction coefficients. In order to verify the appropriateness of the second-order quadratic model fitted to the data as well as to establish the interaction between the operating variables and the responses, ANOVA (analysis of variance) was applied to the data. The model was validated using the values of probability (i.e.P-values) obtained for the estimated parameters’ coefficients, in which a P-value that is less than 0.05 indicates the significance of model terms.
3. RESULTS AND DISCUSSION
3.1. Second-Order Quadratic Polynomial Regression Model
Table 2 shows the biomethanization experimental results. Using the experimental results presented in Table 2, the second-order quadratic polynomial regression model obtained for biomethanization process is presented in Eqs. (2) to (4):


Model equation for hydraulic retention time.
 |
(4) |
Where A, B and C represent the coded values of temperature, total solid content and feed/inoculums ratio, respectively. The coefficients of the model parameters and the correlation coefficient (R2) obtained for each model equation are presented in (Table 3).
| Model factors | Coefficients | P-value | |
|---|---|---|---|
| Constant | 7.00 | <0.0001 | |
| CBY | A | 0.37 | <0.0001 |
| B | -0.049 | 0.0276 | |
| C | -0.091 | 0.0008 | |
| A2 | -0.28 | <0.0001 | |
| B2 | -0.15 | <0.0001 | |
| C2 | -0.065 | 0.0054 | |
| AB | -0.037 | 0.1618 | |
| AC | -0.087 | 0.0055 | |
| BC | -0.14 | 0.0002 | |
| R2 | 0.9929 | ||
| Constant | 69.90 | <0.0001 | |
| A | 3.78 | <0.0001 | |
| BC | B | -0.75 | 0.0007 |
| C | -0.76 | 0.0007 | |
| A2 | -2.77 | <0.0001 | |
| B2 | -1.36 | <0.0001 | |
| C2 | -0.72 | 0.0008 | |
| AB | -0.64 | 0.0109 | |
| AC | -0.71 | 0.0061 | |
| BC | -1.38 | <0.0001 | |
| R2 | 0.9908 | ||
| Constant | 9.00 | <0.0001 | |
| HRT | A | -0.96 | <0.0001 |
| B | 0.39 | <0.0001 | |
| C | 0.81 | <0.0001 | |
| A2 | 1.26 | <0.0001 | |
| B2 | 0.37 | 0.0001 | |
| C2 | 8.813E-03 | 0.0249 | |
| AB | -0.16 | 0.0114 | |
| AC | 0.25 | 0.0114 | |
| BC | 0.50 | 0.0001 | |
| R2 | 0.9900 |
The correlation coefficients (R2= 0.9866, 0.9908 and 0.9900) were obtained for CBY, BC and HRT, respectively. This showed that 99% variance in the biomethanization data was accounted for by the fitted second-order quadratic polynomial regression models, which is of high significance. According to the parameter estimates and values of probability (P-values) less than 0.05 as presented in Table 3, all coefficients of the linear term and quadratic term are statistically highly significant.
3.2. Test for Adequacy of the Fitted Model.
The model accuracy and significance was further tested through the use of ANOVA. Statistical analysis of the ANOVA for all the responses is presented in Table 4.
| Source | Sum of Squares | DF | Mean Square | F-Value | Prob>F | |
|---|---|---|---|---|---|---|
| Model | 3.64 | 9 | 0.40 | 82.04 | <0.0001 | |
| CBY | Residual: Lack of fit Pure Error |
0.049 0.049 0.000 |
10 5 5 |
4.928E-003 9.856E-003 0.000 |
||
| Correlation Total | 3.69 | 19 | ||||
| R2 = 0.9866; Adjusted R2= 0.9746; Predicted R2 = 0.8852; Adequate Precision = 30.669 | ||||||
| Model | 362.19 | 9 | 40.24 | 120.08 | <0.0001 | |
| BC | Residual: Lack of fit Pure Error |
3.35 3.35 0.000 |
10 5 5 |
0.34 0.67 0.000 |
||
| Correlation Total | 365.54 | 19 | ||||
| R2 = 0.9908; Adjusted R2 = 0.9826; Predicted R2 = 0.9193; Adequate Precision = 35.635 | ||||||
| Model | 51.48 | 9 | 5.72 | 109.48 | <0.0001 | |
| HRT | Residual: Lack of fit Pure Error |
0.52 0.52 0.000 |
10 5 5 |
0.052 0.10 0.000 |
||
| Correlation Total | 52.00 | 19 | ||||
| R2 = 0.9900; Adjusted R2= 0.9809; Predicted R2 = 0.9237; Adequate Precision = 43.104 | ||||||
As presented in Table 4, it is seen that the model F-value for the CBY, BC in the biogas and HRT (82.04, 104.62 and 109.48) respectively were significant at 95% confidence interval implying good model fit. Thus, the second-order polynomial regression models appropriately describes the CBY, BC and HRT of the biomethanization process. There were no outliers to the regression. Also, it is seen that the P-values for the models are less than 0.05, indicating significance of the terms in the model. The value of adequate precision greater than 4 indicates the desirability of the model. In this study, the value of adequate precision was respectively found to be 30.669, 35.635 and 43.104 for CBY, BC in the biogas and HRT, indicating an adequate signal to noise ratio. The adjusted R2 value of (0.9746, 0.9826 and 0.9809) for the responses are close to 1.0, which suggest the high reliability of the model to predict the results of biomethanization. Predicted R2 value (0.8852, 0.9193 and 0.9237) which are relatively high for the responses indicates that the predicted biomethanization results and the observed experimental results are in good concordance.
Fig. (2A) shows the normal probability plots of the residuals (differential between the results predicted by the model and the experimental observed values) and the plots of the experimental observed values versus values of predicted results.
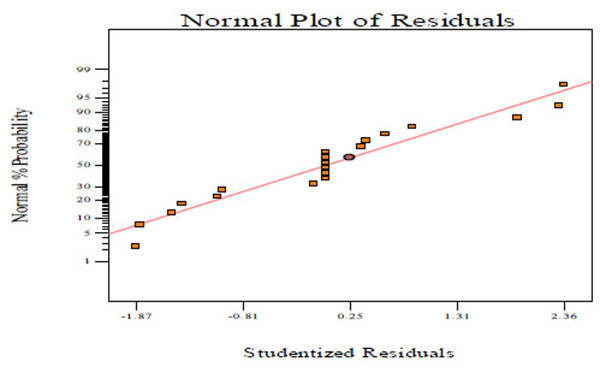
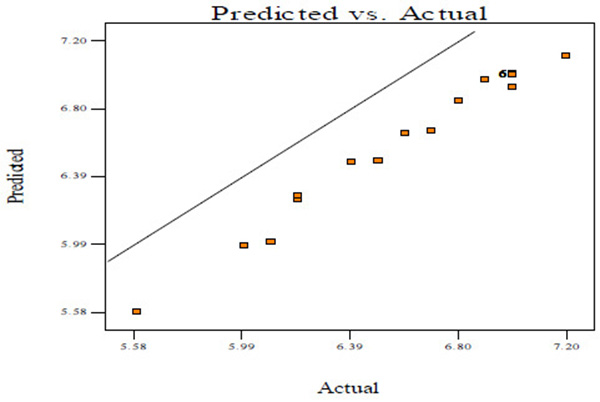
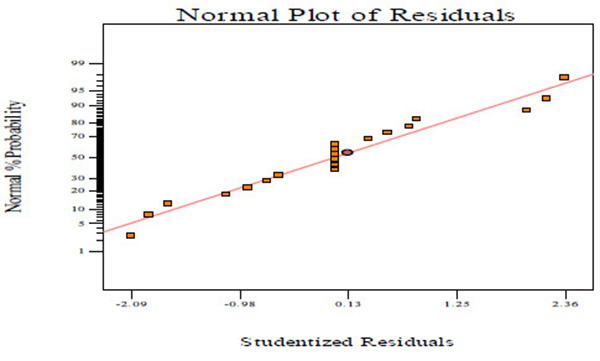
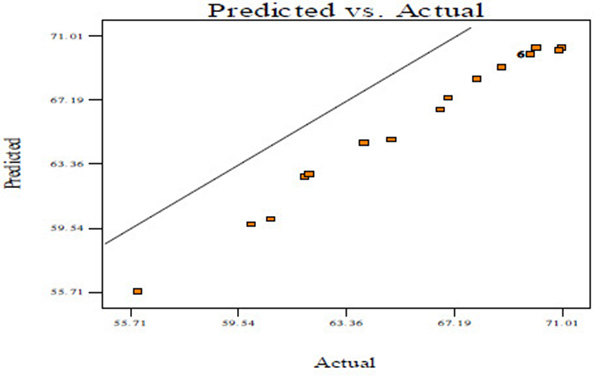
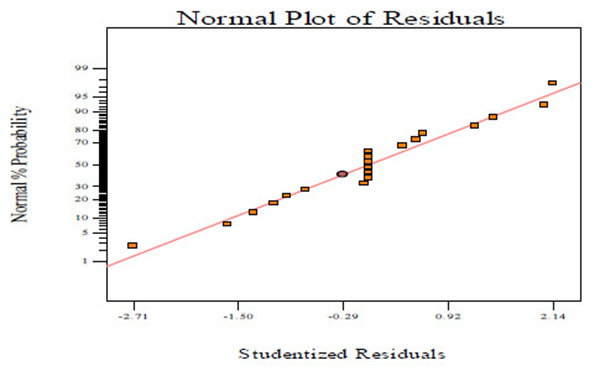
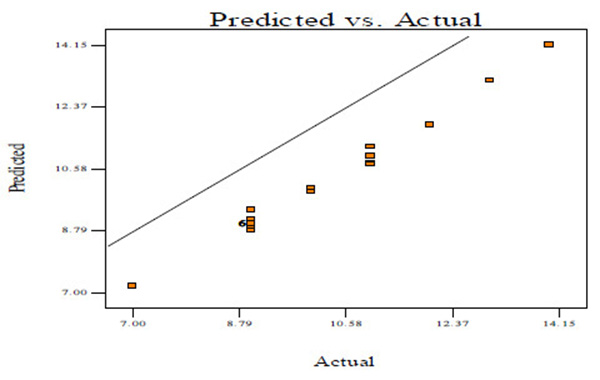
Figs. (2A, C and E) manifests that the plots of normal probability are close to a linear regression line, which indicates the hypothesis of the analysis fulfilment. Figs. (2B, D and E) revealed that the predicted values of CBY, BC in the biogas and HRT obtained from Eqs. (2) – (4) are in good agreement with experimental values.
The linear and quadratic effects of temperature on HRT is positively high. The linear effect of temperature on CBY is positive while the quadratic effect on CBY is negative. The linear and quadratic effects of temperature on BC quality is negative. The linear and quadratic effects of total solid content on BC quality is highly negative as compared to its effect on CBY, but its linear and quadratic effects on HRT is negative. The linear and quadratic effects of feed/inoculums ratio on CBY and BC quality is respectively negative, while its linear effect on HRT is positive and its quadratic effect on HRT is negative.
The respective interactive effect between temperature and total solid content on CBY is not significant, while the interactive effect between temperature and total solid content on BC and HRT is significant and negative, respectively. Respective interactive effect between temperature and feed/inoculums ratio on CBY and BC is significant and negative, while the interactive effect between temperature and feed/inoculums ratio on HRT is respectively significant and positive. Furthermore, the respective interactive effect between total solid content and feed/inoculums ratio on CBY and BC is also significant and negative, while its interactive effect on HRT is significant and positive.
3.3. Interaction Effect of Operating Variables
Three dimensional (3D) response surface and interaction effect plots based on the second-order quadratic polynomial regression (Eqs. (2) - (4)) for the CBY, BC in the biogas and HRT are obtained and illustrated in Figs. (3-5), respectively. Since the interactive effect between temperature and total solid content on CBY is not significant, hence the 3D surface and interaction plot is not shown while the effect of temperature and total solid content on BC as well as on HRT is respectively remarkable as shown in Figs. (3A-D).
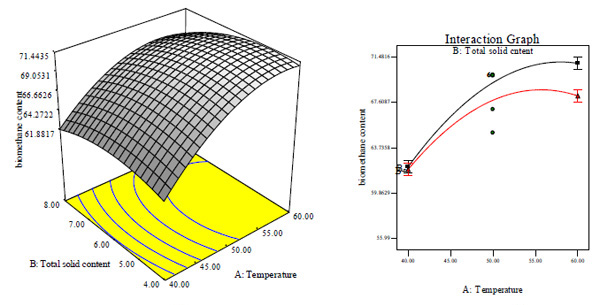
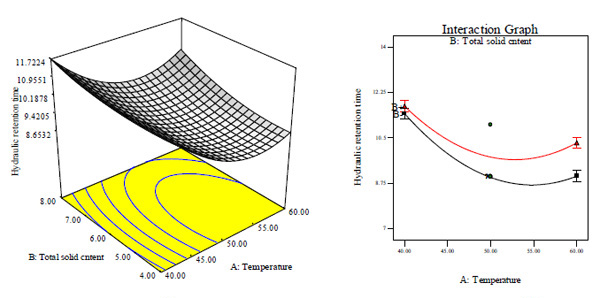
At both lower and higher total solid content, BC increased with increase in temperature as shown in Figs. (3A and B). At constant total solid content of 6%, BC is quite good and higher at lower feed/inoculums ratio and high temperature (Fig. 3A and B). It seemed that increase in temperature had significantly high effect on the biomethanization process at different total solid content and feed/inoculums ratio. This observation may perhaps be as a result of temperature having a higher coefficient and lower p-values than total solid content and feed/inoculums ratio (Table 3). Further increase in temperature led to decrease of BC at both lower and higher total solid content. In general, biodigestion relies on temperature. Thus, it is very obvious that the biodigestion rate of animal wastes co-digested with waste of pineapple fruit and content of chicken-gizzard became rapid at higher temperature which could have been the cause for high BC. At lower temperature, HRT increased with increase in total solid content (Figs. 3A and C). It seemed that the biogas production was influenced significantly by temperature and total solid content. Under this condition, temperature of 50°C and total solid content of 6% gave a minimum HRT of 9 days (Figs. 3A, C and D). Further increase in temperature and total solid content above the optimum value will lead to increase in HRT. There was a significantly high effect of temperature on biomethanization process.
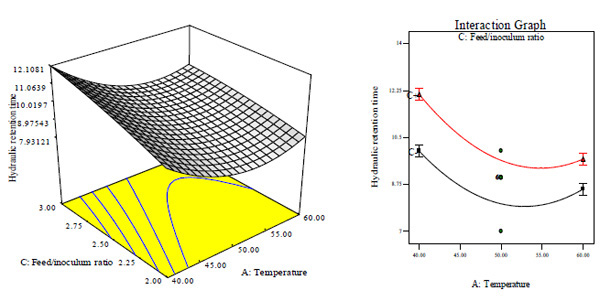
The three dimensional surface and interaction plots for the effect of interaction between temperature and feed/inoculums ratio on CBY, BC and HRT at constant total solid content of 6% is shown in Figs. (4A and B).
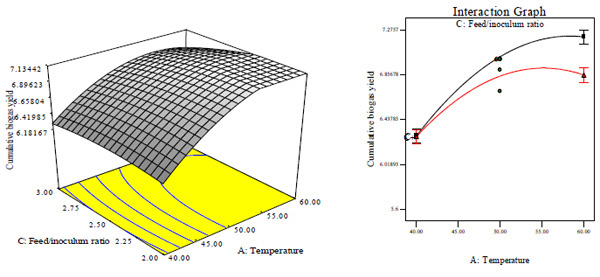


At lower feed/inoculums ratio, CBY and BC increased with increase in temperature as depicted by Figs. (4A and B) as well as Figs. (4C and D). This observation may be as a result of temperature having a higher coefficient and lower p- values than feed/inoculums ratio (Table 3). Under this condition, temperature of 50°C and feed/inoculums ratio of 1:2 gave the highest CBY and BC, respectively. In addition, there was significantly negative interaction between temperature and feed/inoculum ratio. This indicates that CBY and BC respectively decreases at very high temperature and high feed inoculum ratio above the optimum. That is, it is observed that biomethanization process is more influenced by temperature as an operating variable. A similar observation has been reported by Yusof et al. [9] that methane yield increased with increase in temperature from 25 to 35°C and above 35°C, the yield decreased. In addition, Liu et al. [36] reported that higher methane yield at fixed feed/inoculum ratio of 3.1 was generated at thermophilic temperature of 50°C than at mesophilic temperature of 35°C. At lower temperature, HRT decreases with increase in feed/inoculums ratio (Figs. 4E and F). This observation may be because of the feed/inoculums ratio possessing a value of coefficient higher than the value for temperature (Table 3). Under this condition, temperature of 50°C and feed/inoculums ratio of 1:1.6 gave a minimum HRT of 9 days. However, further increase in temperature and feed/inoculums ratio above the optimum value will lead to increased HRT. The effects of the total solid content and feed/inoculums ratio on CBY, BC and HRT at constant temperature of 50°C are depicted in Figs. (5A and F)
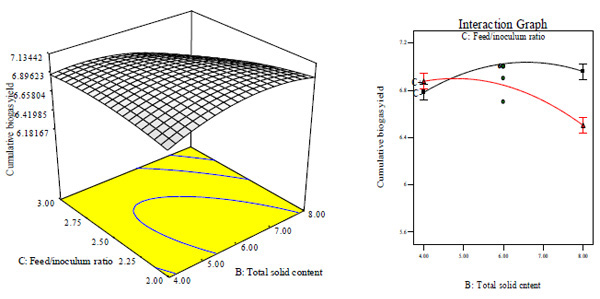
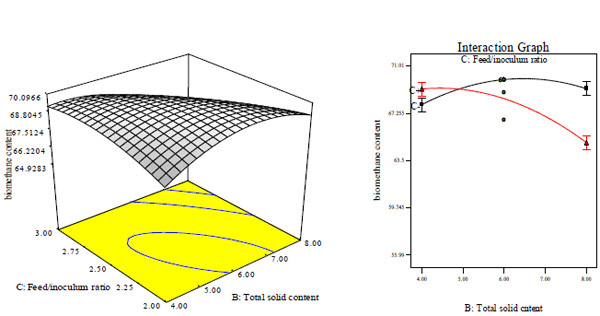
Figs. (5A and B) as well as Figs. (5C and D) suggest that at lower total solid content, CBY and BC respectively increased with increase in feed/inoculums ratio. This may be as a result of the feed/inoculums ratio possessing a coefficient value that is higher with a lower p- value than the values for total solid content (Table 3). The CBY and BC were respectively influenced significantly by total solid content and feed/inoculums ratio and the optimal total solid content was about 8% and feed/inoculums ratio was around 1:2. Increase in total solid content and feed/inoculums ratio above the optimum value will have negative effect on CBY and BC, respectively. That is, CBY and BC will respectively decreased with increase in total solid content and feed/inoculums ratio above the optimum corresponding value of 8% and 1:2.
Similar observations have been reported by Cheng et al. that biogas generation from cotton stalk increased with increase in feed/inoculum ratio from 2 – 4 and later decreased at feed/inoculum ratio of 6 while Ardaji et al. reported the increase in biogas generation from pomegranate waste, poultry manure and cow dung sludge with increased total solid content from 5 – 25% and then decreased at 30% total solid content.[37, 38]. Furthermore, Dadaser-celik et al. have reported the significant greater contribution of solid content followed by feed/inoculum in the generation of biogas from food waste [39]. At lower total solid content, HRT increased with decrease in feed/inoculums ratio, while it decreased with increase in feed/inoculum ratio (Figs. 5A, E and F). It may be because of the feed/inoculums ratio having a value of coefficient greater than the value for total solid content (Table 3). The HRT was influenced significantly by total solid content and feed/inoculums ratio of which the minimum HRT was found to be 9 days obtained at optimal total solid content value of about 6% and feed/inoculums ratio of 1:1.6. Further increase in total solid content and feed/inoculums ratio above the optimum value will result in increased (i.e. negative effect) HRT.
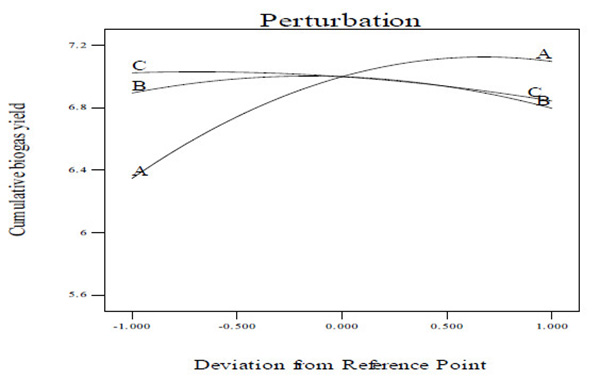
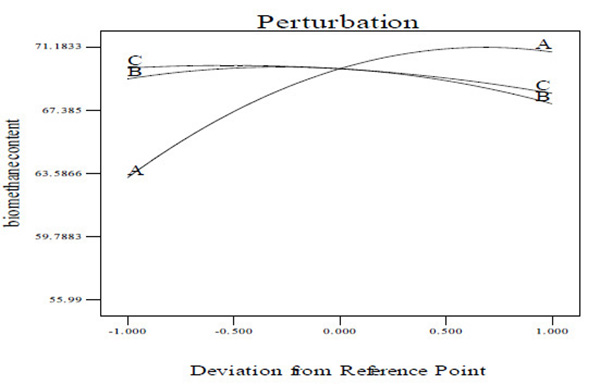
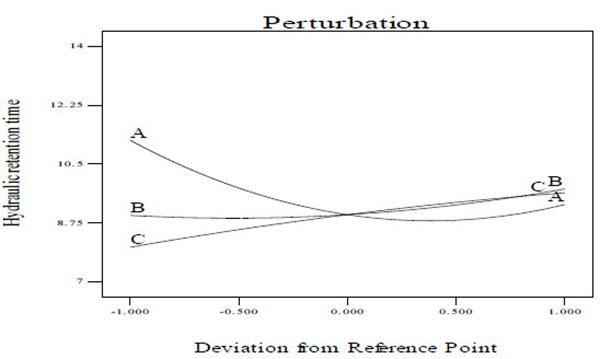
3.4. Perturbation Plot
A perturbation plot compares the impact of all the variables at a particular point in the design space [40]. In a perturbation plot, when the variable produces a steep slope or curvature, then the response is sensitive to that variable [40]. Thus, the perturbation plot (Figs. 6A and C) was used to evaluate graphically the effect of each variable on CBY, BC and HRT, respectively. From the perturbation plot as shown in (Figs. 6A and C), it is observed that each of the variable (temperature, total solid content and feed/inoculum ratio) utilized in this work has its individual impact on CBY, BC and HRT, respectively. It has been observed that that a step increase in temperature, total solid content and feed/inoculum ratio from lower level (coded value of –1) to a high level (coded value of 0, being the reference point) brought about increase in the CBY and BC, respectively (Figs. 6A and B). However, increase in these variables above the reference point to a higher level (coded value of +1) resulted in the decrease of CBY and BC, respectively (Figs. 6A and B). Also, a step increase in temperature from coded value of –1 (i.e. lower level) to coded value of 0 (i.e. high level, being the reference point) resulted in the decrease in HRT, and increase in temperature above the reference point to a coded value of +1 (i.e. higher level) brought about increase in the HRT (Fig. 6C). Meanwhile, there seems to be no change in the HRT with increase in the total solid content from lower level (coded value of -1) to a high level with coded value of 0, however, increase in the total solid content above the high level with coded value of 0 to a higher level with coded value of +1 resulted in increase in the HRT (Fig. 6C). In addition, a step change in the feed/inoculum ratio from coded value of –1 (i.e. lower level) to a higher level with coded value of +1 led to increase in the HRT (Fig. 6C). Nevertheless, it is observed from Figs. (6A-C) that over the range of temperature from 30 to 60°C, the CBY, BC and HRT changed in a relatively wide range which was not the case for both total solid content and feed/inoculum ratio. This ultimately reveals that holding total solid content and feed/inoculum ratio respectively at their optimum level, a perturbation or step change in temperature impacts the biomethanization process more severely than done otherwise.
3.5. Optimization and Validation of the Biomethanization Process
The operating conditions of the variables that are workable and optimum for the biomethanization process were determined using the numerical optimization tool in Design-Expert (6.08) software package. In the use of this tool, temperature, total solid content and feed/inoculums ratio was each set in a range of values based on the required goal of biomethanization; CBY and BC in the biogas was set on maximize and the HRT was set on minimize. Temperature of 55.2°C, total solid content of 6.25% and feed/inoculums ratio of 1:2 were found to be the optimum operating conditions (predicted) required to produce a predicted maximum CBY of 7.20 kg that contains 71.54% maximum BC in 8 days HRT. The desirability was 1.00 for the experiment (Fig. 7).

Experiment to validate the determined maximum CBY, BC and HRT at the predicted optimum operating conditions of temperature (55.2 oC), total solid content (6.25%) and feed/inoculums ratio (1:2) was carried out. In the optimized condition for biomethanization process of the mixture of animal wastes in co-digestion with waste of pineapple fruit and content of chicken-gizzard, 7.15 kg CBY which contained 71% BC produced in 7 days HRT was obtained from the validation experiment. The error in percentage (Eq. (5)) between the predicted and actual observed values was respectively obtained as: -0.05,-1.54 and -1 for CBY, BC in the biogas and HRT. This revealed that there is no significant difference in the results.
 |
(5) |
As it could be seen in Table 4 in the un-optimized condition, the highest CBY, BC in the biogas and HRT was 6.261 dm3/g of slurry, 71.01% and 9 days, respectively. While in the optimized condition, the highest CBY, respectively. The results clearly indicated the effectiveness of process variables optimization in biomethanization process.
CONCLUSION
In this work, the focus was on the optimization of operating variables conditions required for the biomethanization of cattle manure, pig manure and poultry manure mixture in co-digestion with waste of pineapple fruit and content of chicken-gizzard using the RCCD of response surface methodology. From the results obtained, it can be concluded that response surface methodology as a veritable statistical modelling tool can be practically applied to predict and determine the optimum operating conditions required for the conversion of any form of biomass wastes into biogas/biomethane. Temperature, total solid content, and feed/inoculums ratio being the operating variables have significant linear, quadratic and interactive effects on the effective production of biogas/biomethane in terms of the cumulative biogas yield, biomethane content and the hydraulic retention. Maximum (or optimum) cumulative biogas yield of 6.217 dm3/g of slurry with a biomethane content of 71% can be obtained in 7 days hydraulic retention time from the biomethanization of cattle manure, pig manure and poultry manure mixture in co-digestion with waste of pineapple fruit and content of chicken-gizzard when the operating variables conditions are respectively set at the optimum values of temperature, 55.2oC, total solid content, 6.25% and feed/inoculum ratio, 1:2.
ETHICS APPROVAL AND CONSENT TO PARTICIPATE
Not applicable.
HUMAN AND ANIMAL RIGHTS
No Animals/Humans were used for studies that are base of this research.
CONSENT FOR PUBLICATION
Not applicable.
CONFLICT OF INTEREST
The authors confirm that the content of this article has no conflict of interest.
ACKNOWLEDGEMENTS
The authors would like to thank the technical staff of the Central Research Laboratory of Ladoke Akintola University of Technology, Ogbomoso for the access, help, support and use of the laboratory facilities.